Wireshark
Analyze Network Traffic using Wireshark
Step 1: Launch Wireshark:
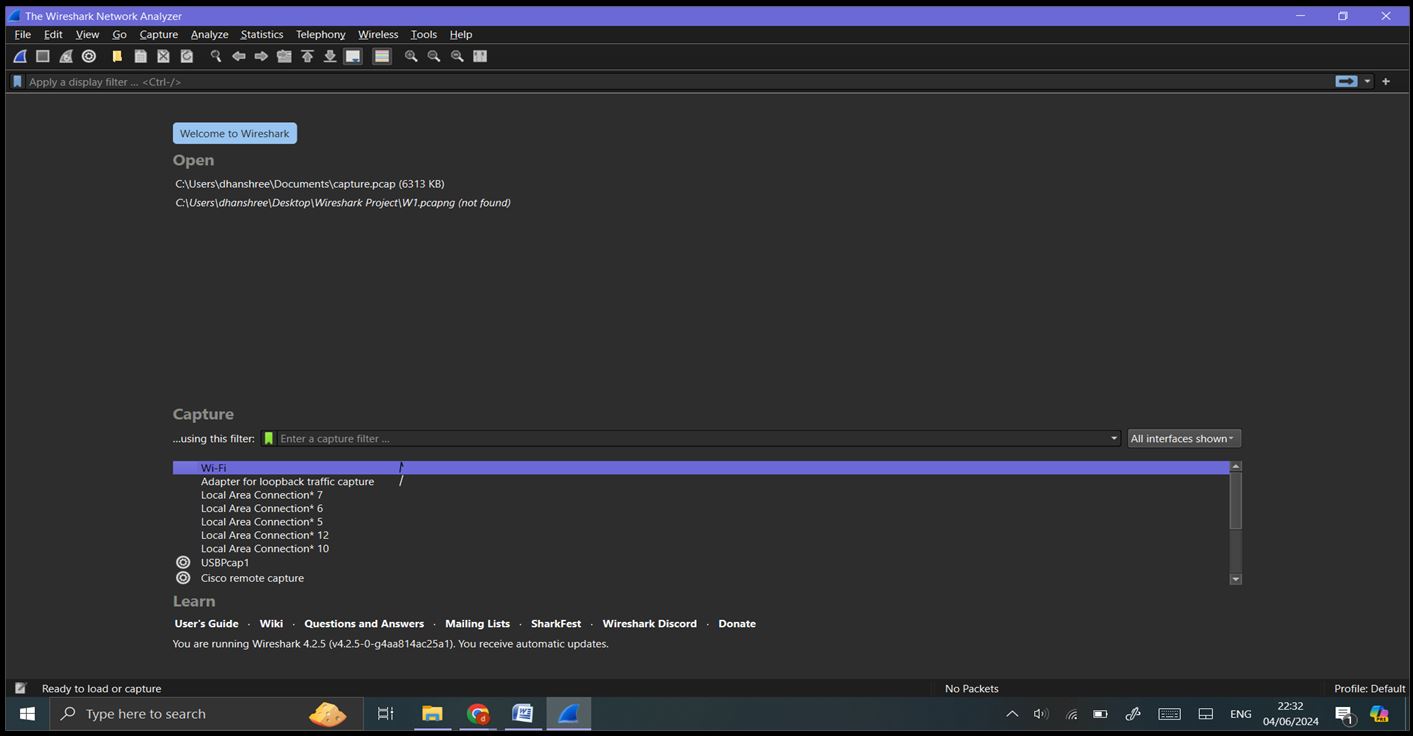
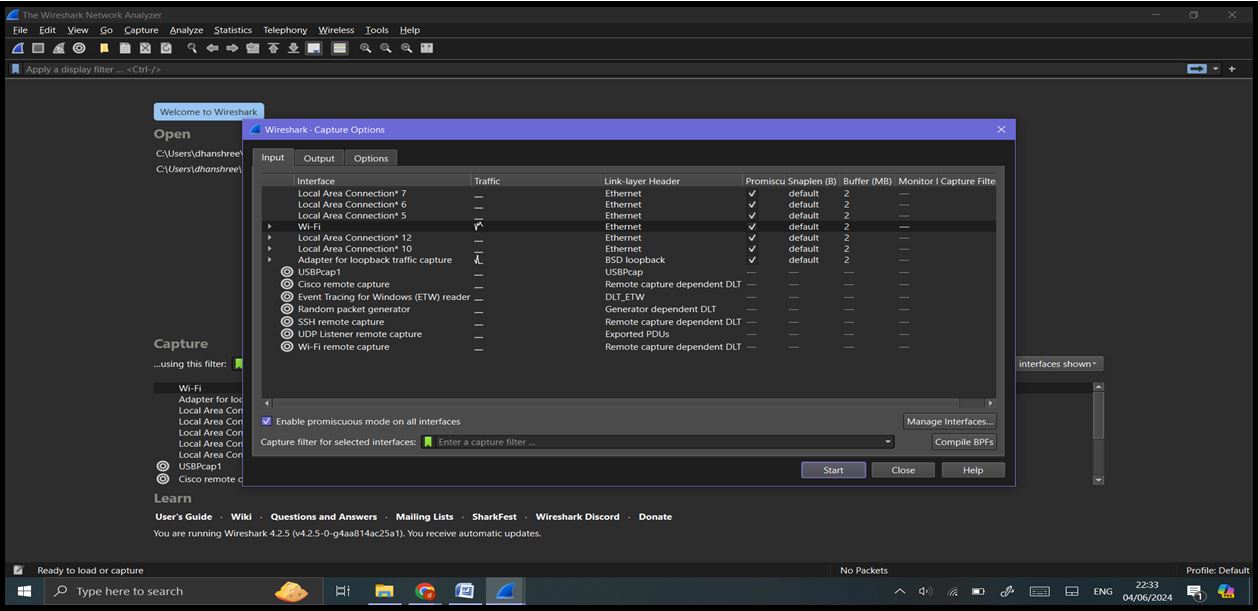
Step 2: Capture Interfaces: Click on ‘Capture’ -> ‘Options’ or the gear icon in the toolbar to see a list of available network interfaces. Identify and select the interface through which you want to capture network traffic (e.g., Wi-Fi).
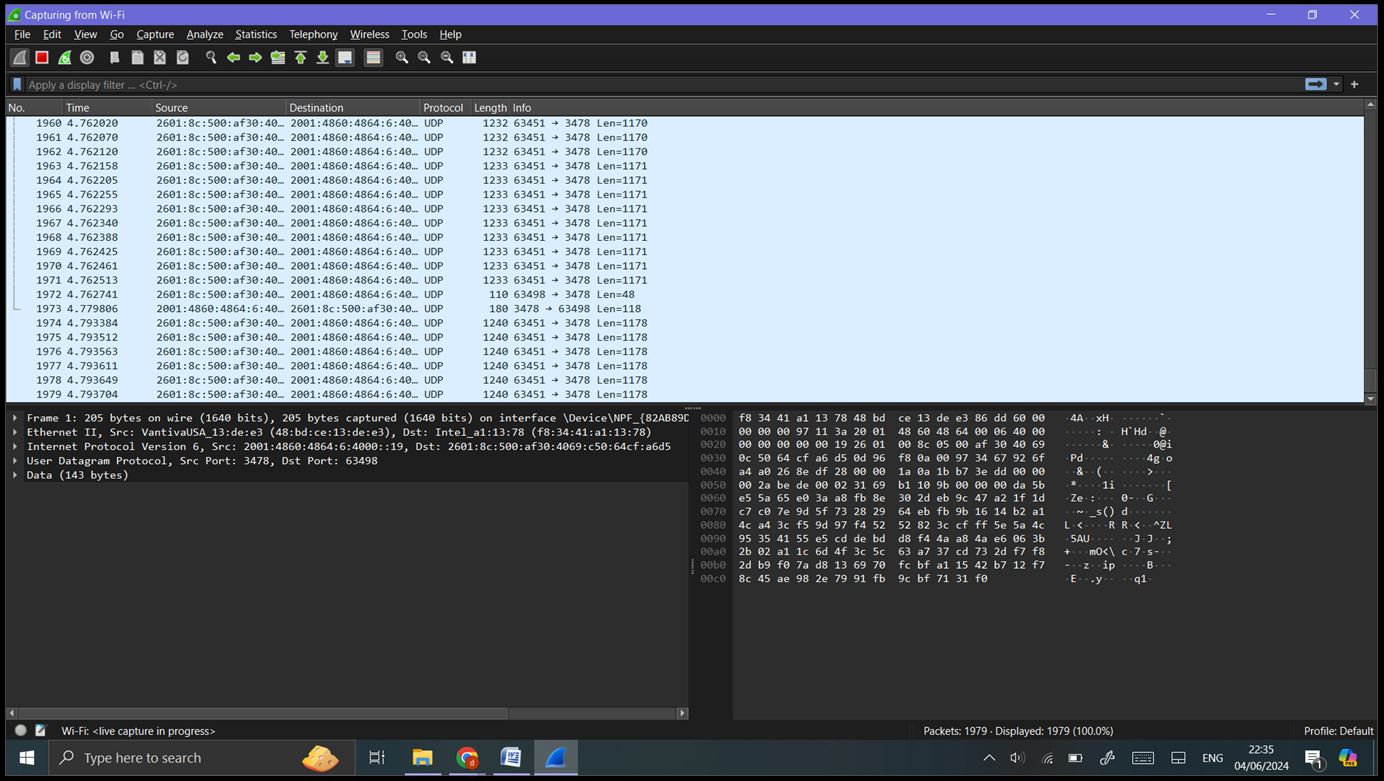
Step 3: Capturing Network Traffic: Start Capturing: Select the desired network interface. Click the shark fin icon (Start Capturing Packets) or press ‘Ctrl+E’. Wireshark will start capturing all the packets flowing through the selected interface.
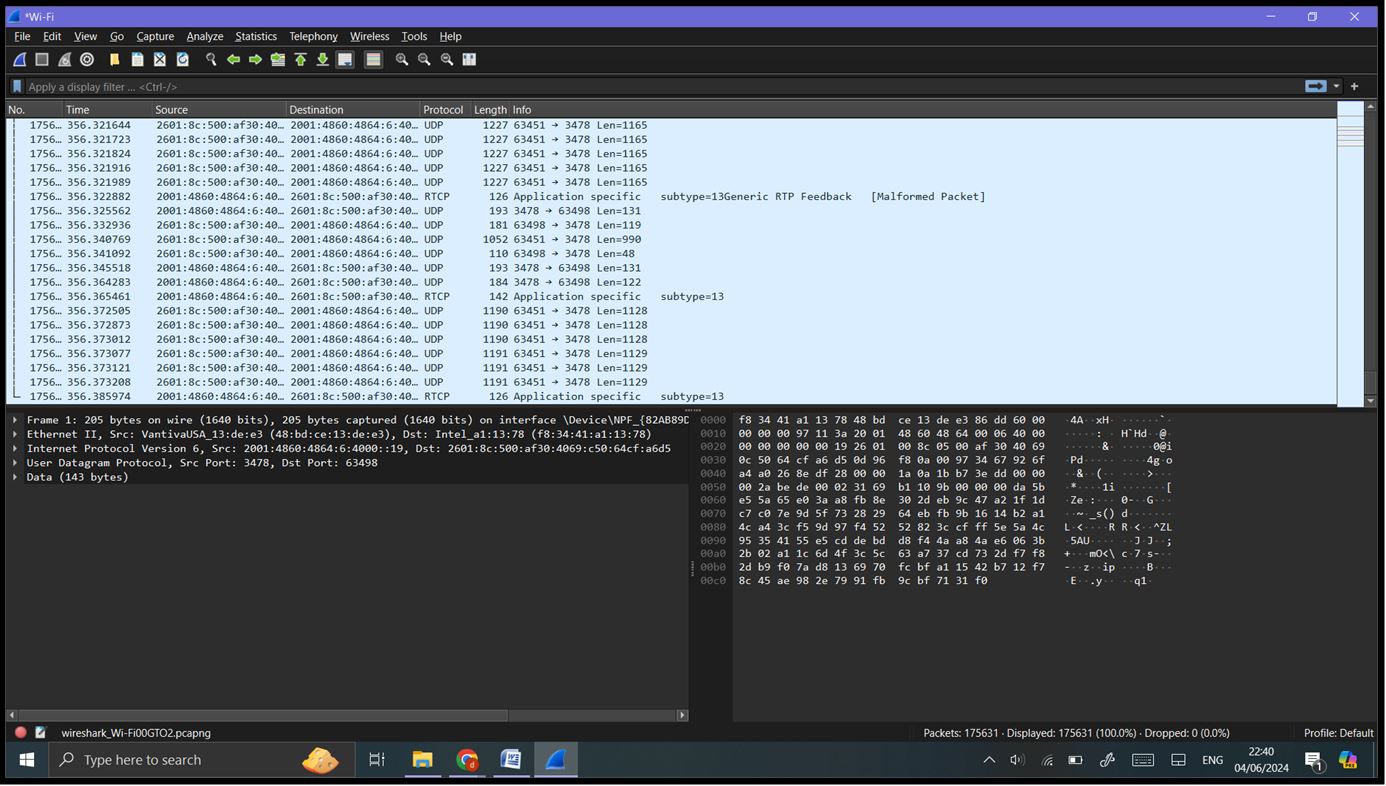
Generate Traffic: Perform normal network activities such as browsing the web, streaming videos, or downloading files.

Stop Capturing: Click the red square icon (Stop Capturing Packets) or press ‘Ctrl+E’ again to stop capturing.
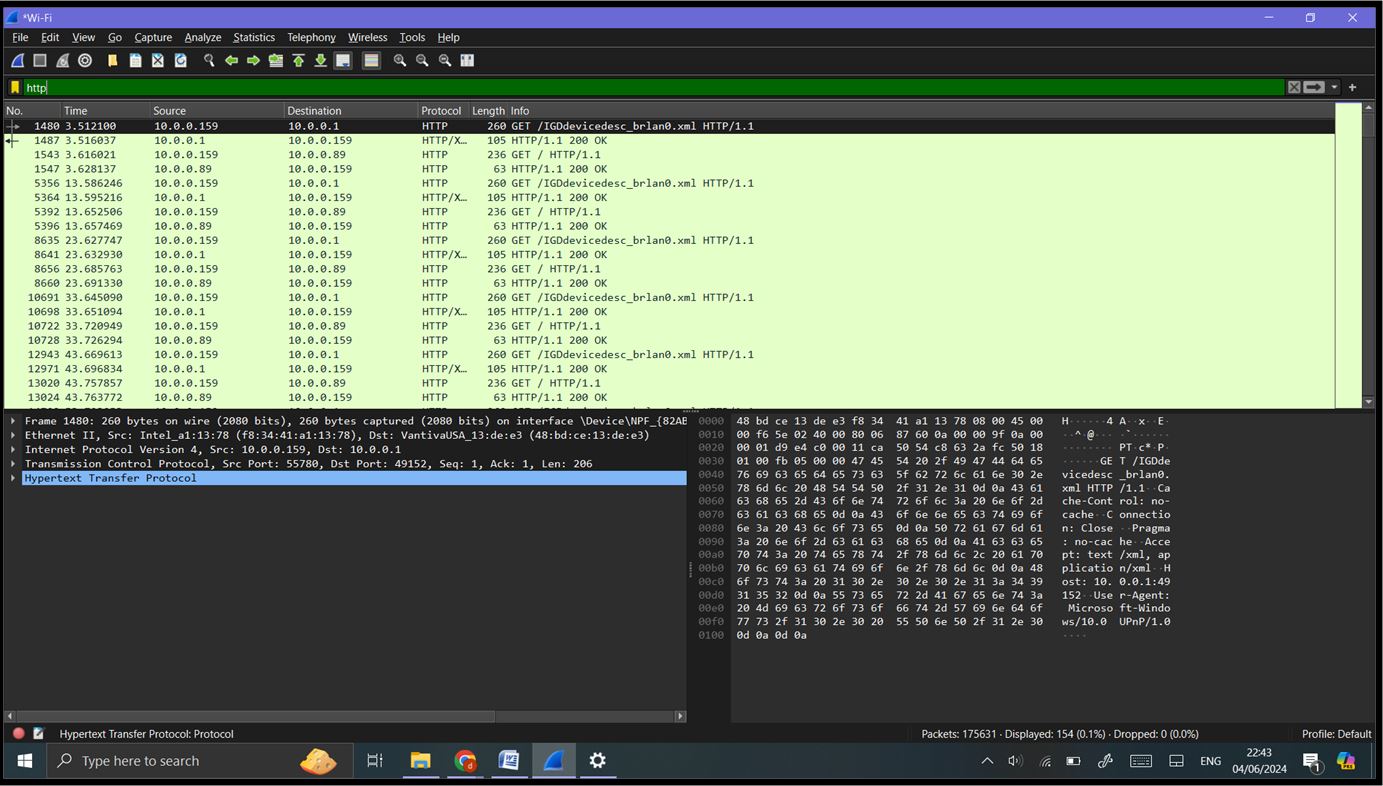
Step 4: Analyzing Captured Data: Basic Filtering: Use the display filter bar at the top to filter specific types of traffic. HTTP traffic: ‘http’
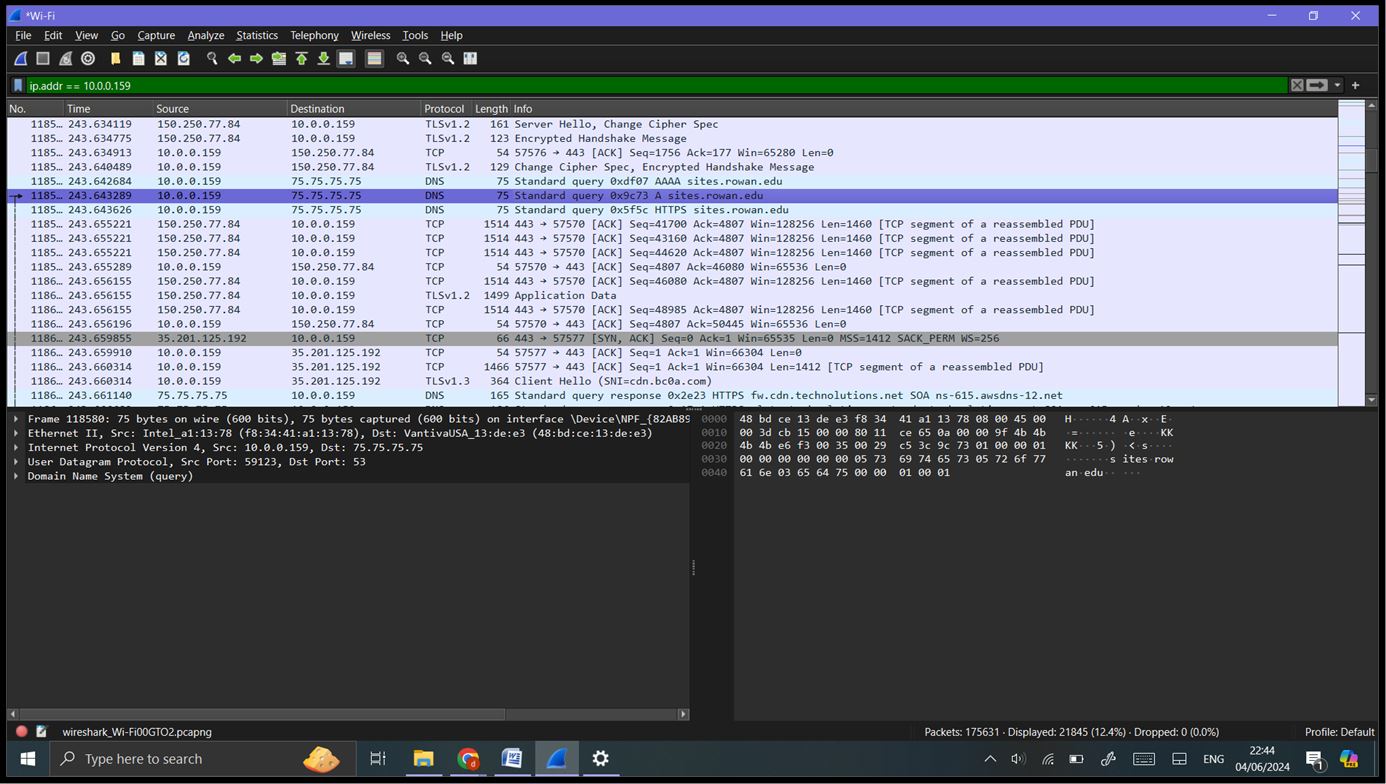
Filter by IP address: ‘ip.addr == 10.0.0.159’
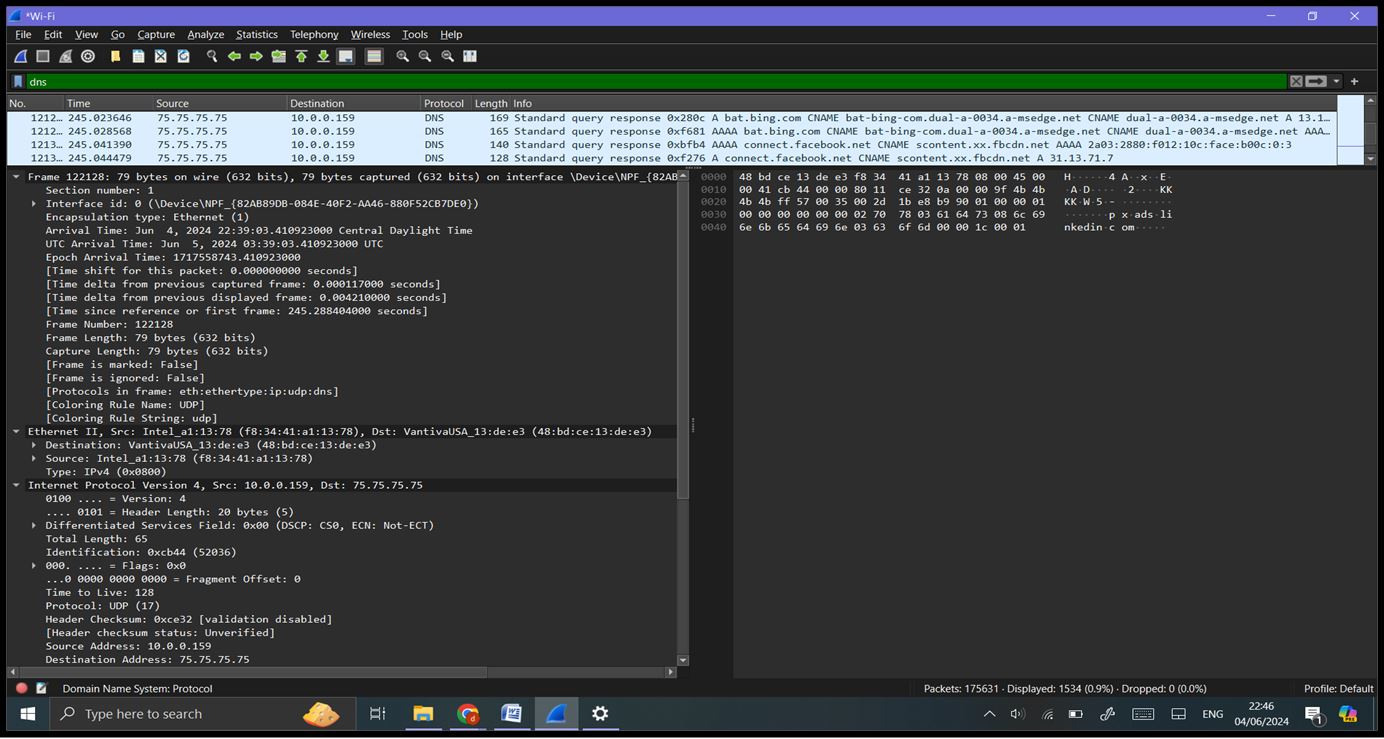
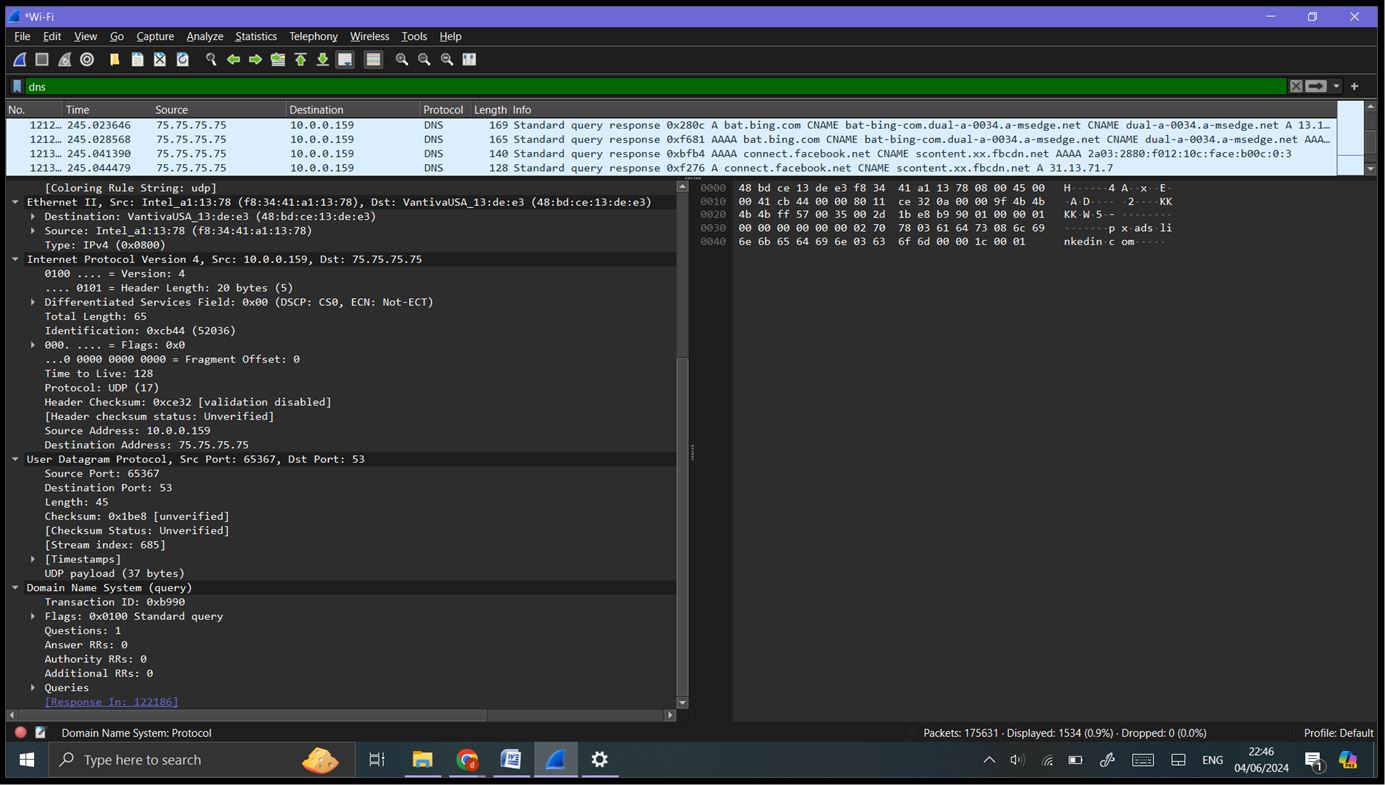
Filter DNS traffic: ‘dns’
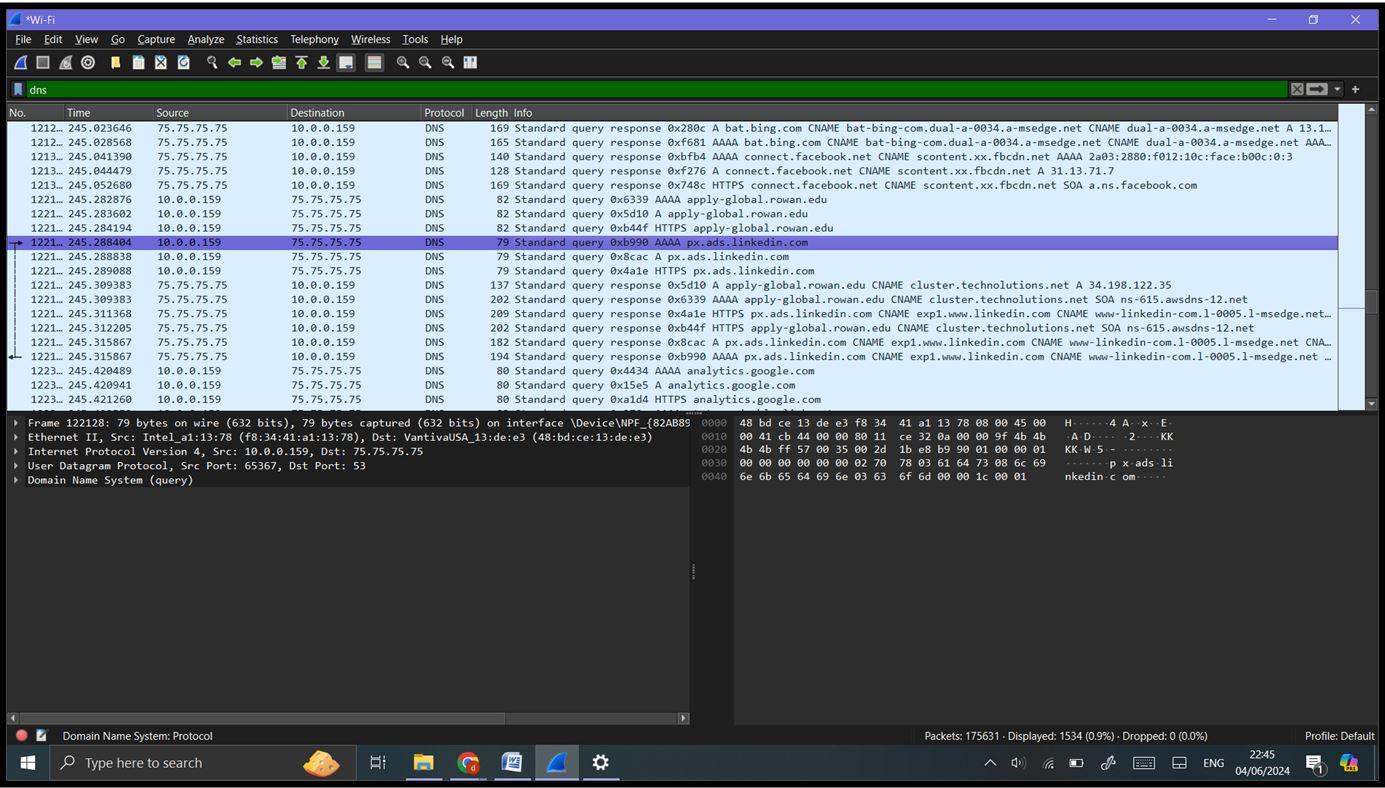
Step 5: Inspecting Packets: Click on any packet in the Packet List Pane to highlight it. The Packet Details Pane will show detailed information about the selected packet, broken down byprotocol layers (e.g., Ethernet, IP, TCP/UDP). Expand the sections to view more details about each protocol layer. The Packet Bytes Pane shows the raw data (hexadecimal and ASCII) of the selected packet.
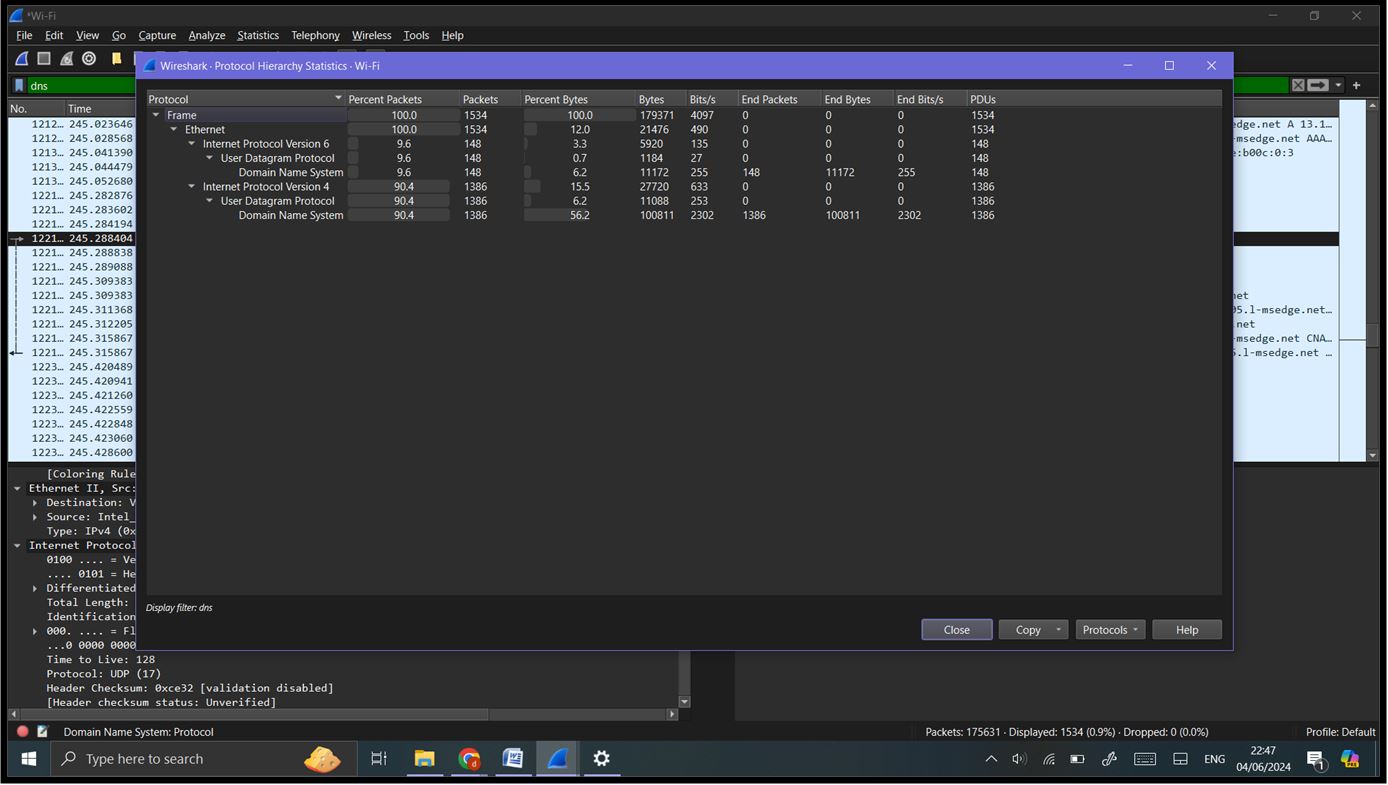
Step 6: Advanced Analysis: Using Statistics: Protocol Hierarchy: Go to ‘Statistics’ -> ‘Protocol Hierarchy’. This shows a breakdown of all protocols used in the captured traffic.
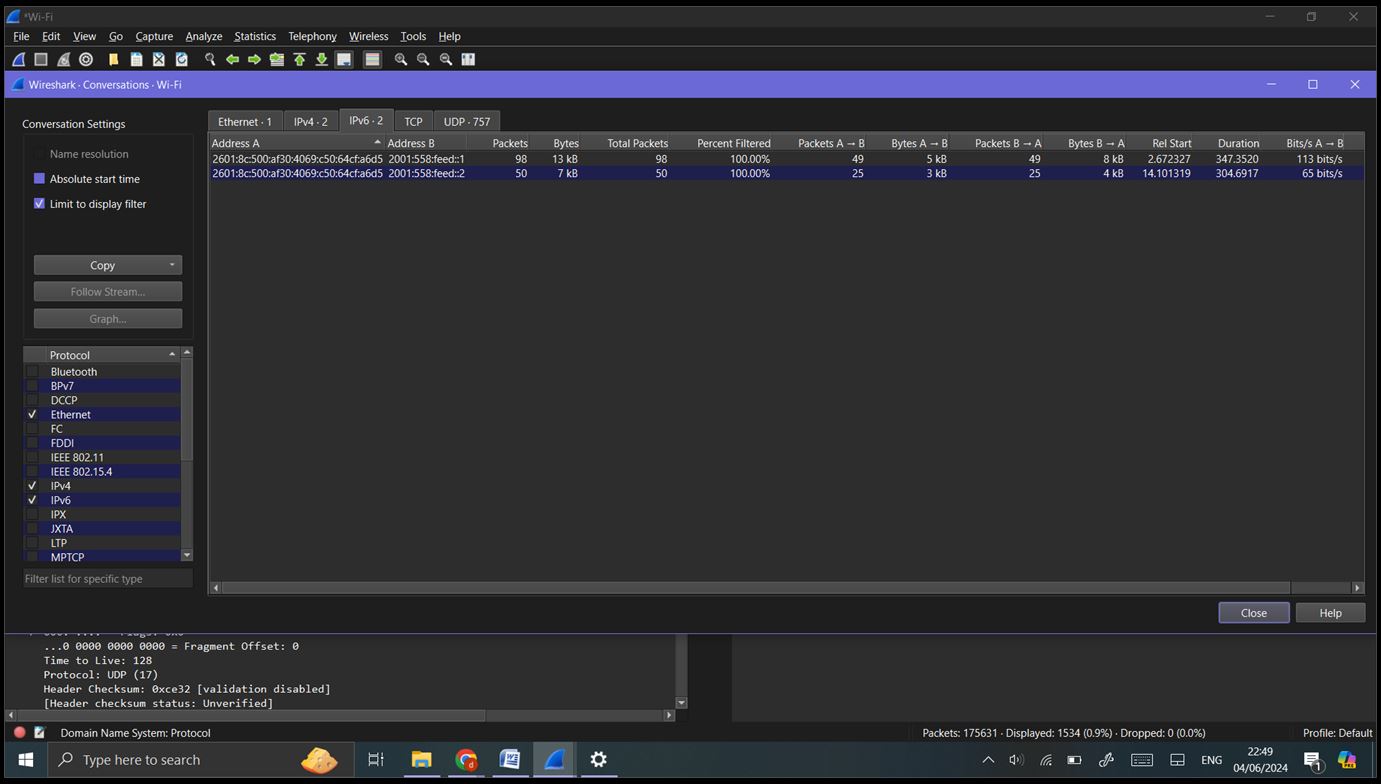
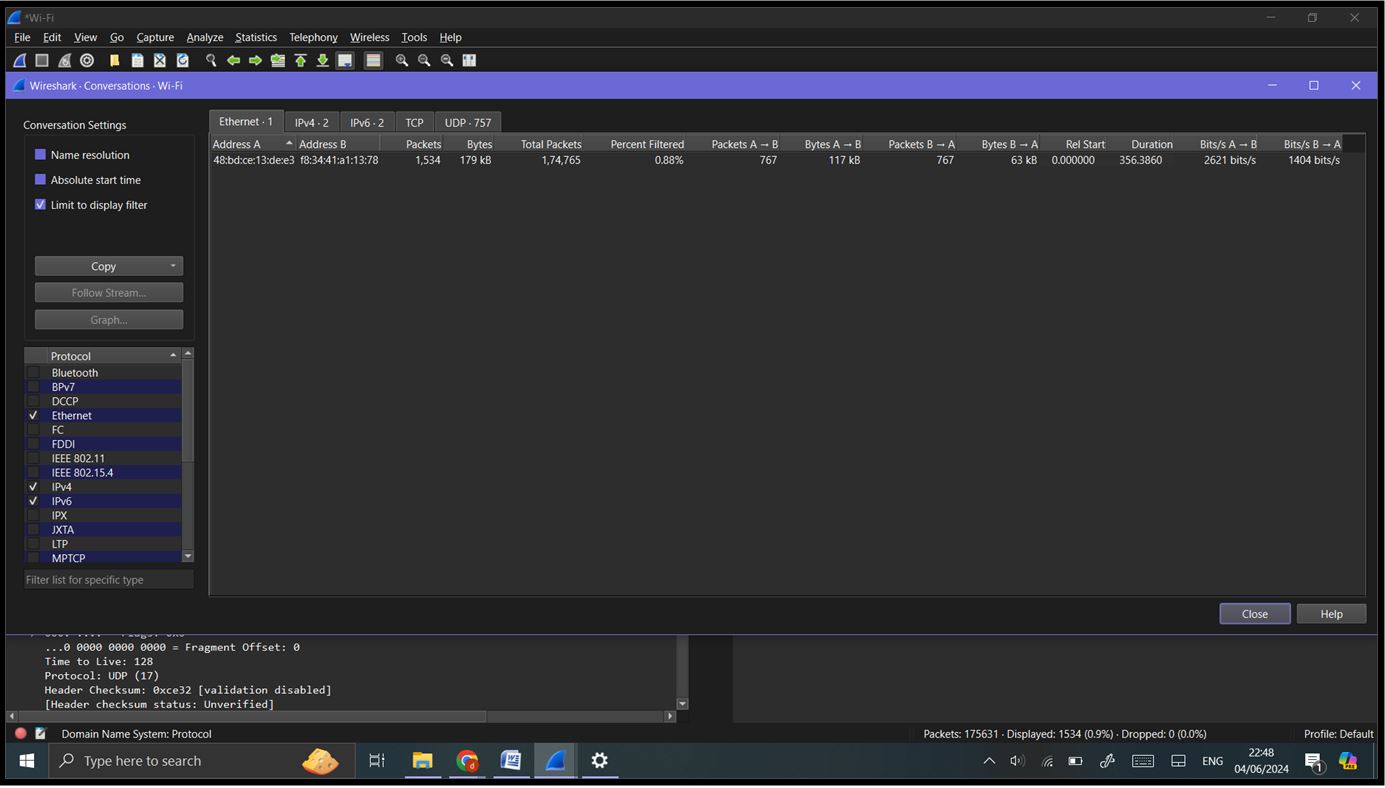
Conversations: Go to ‘Statistics’ -> ‘Conversations’. This provides detailed information about communication between network endpoints.
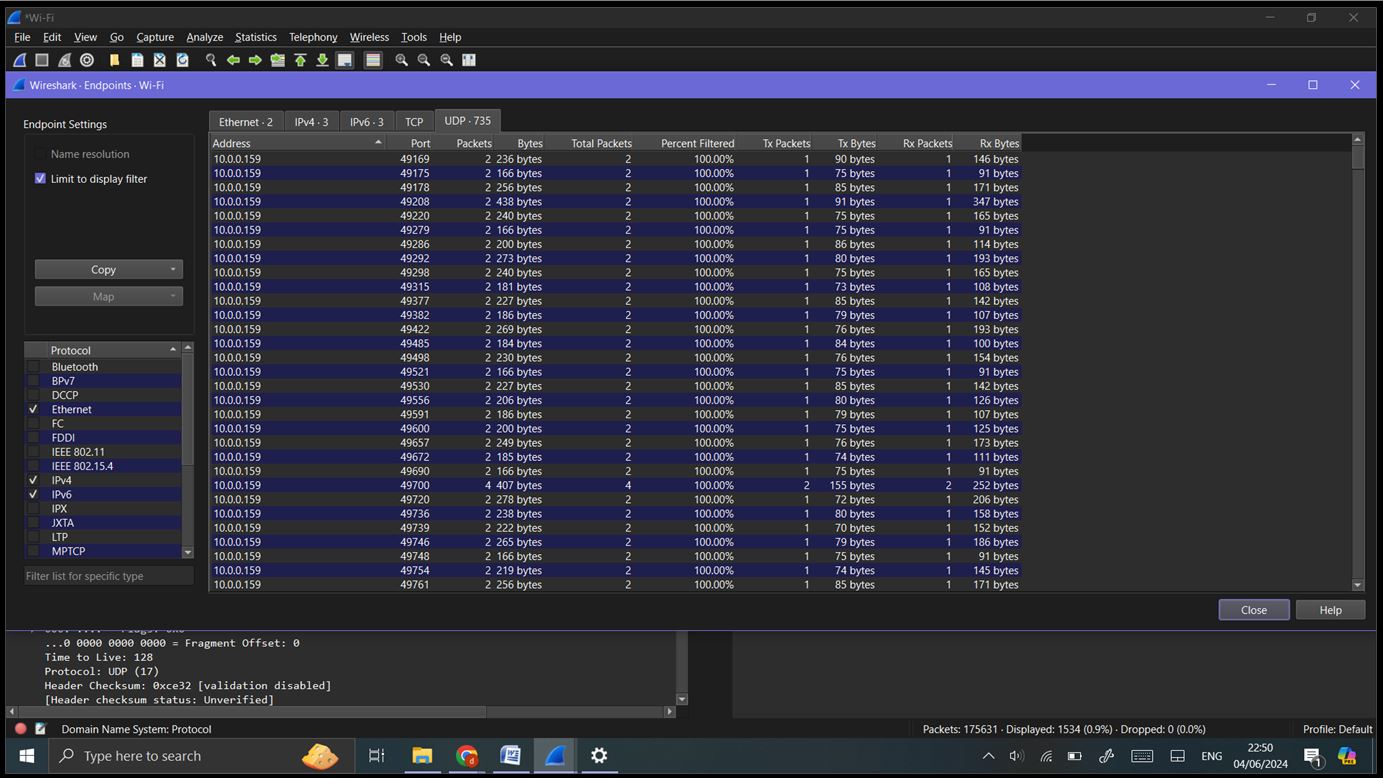
Endpoints: Go to ‘Statistics’ -> ‘Endpoints’. Lists all IP addresses involved in the capture, with details about data sent and received.
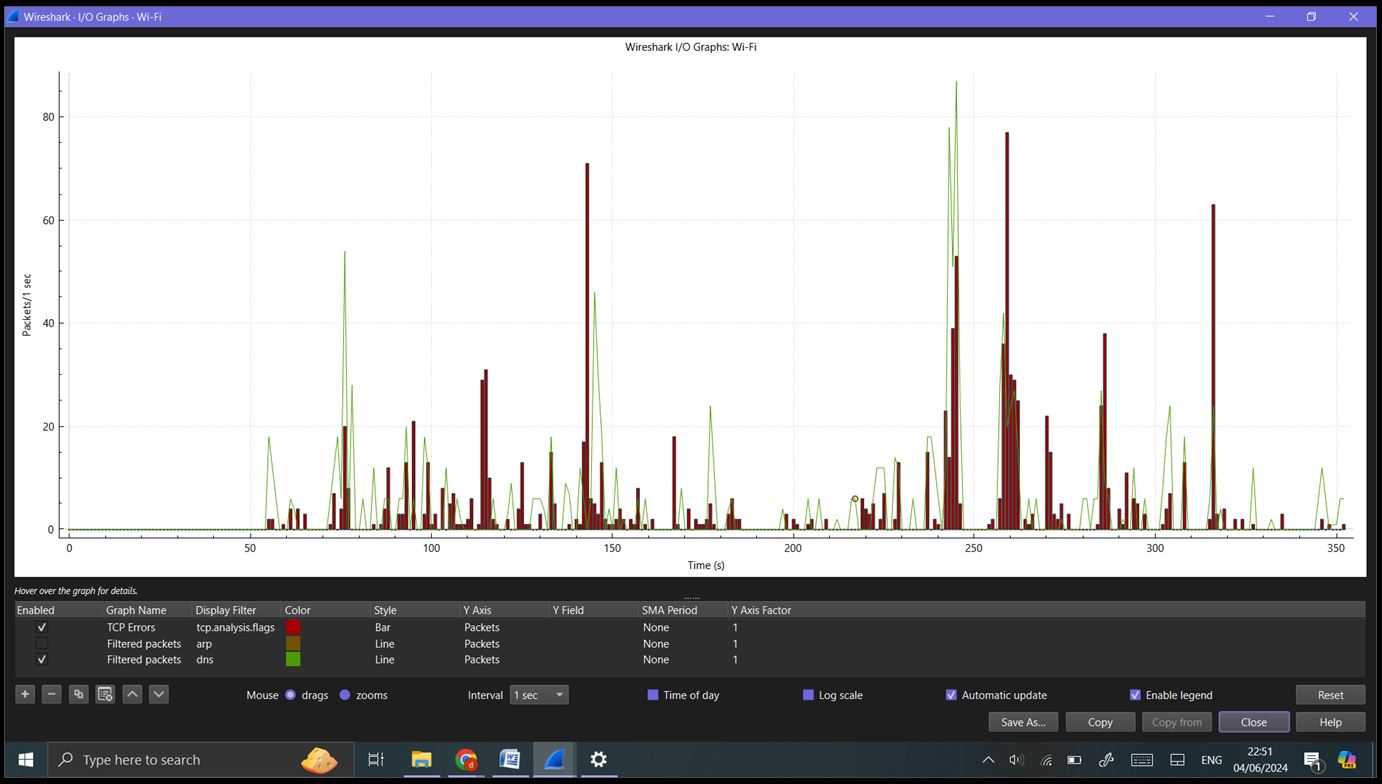
IO Graphs: Go to ‘Statistics’ -> ‘IO Graphs’. Allows you to visualize traffic patterns over time. Customize the graph to highlight specific protocols or traffic types.
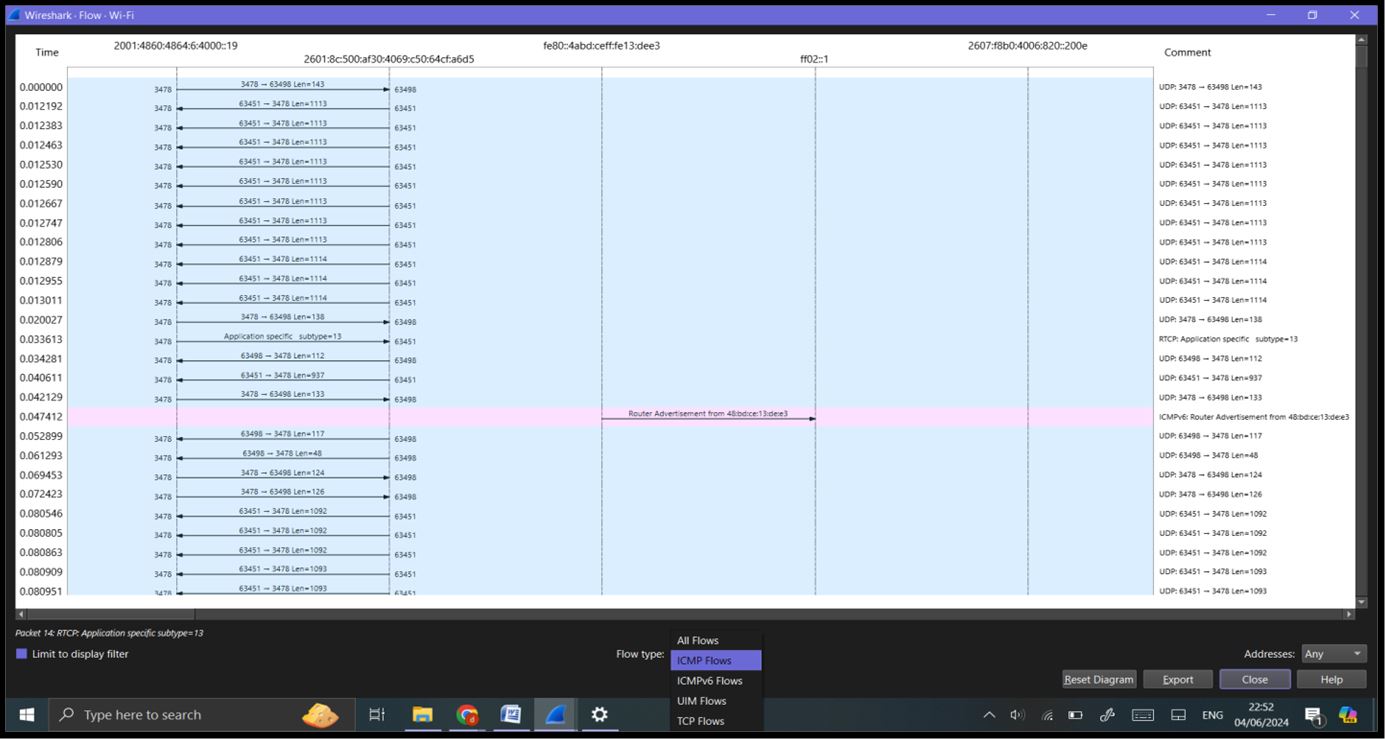
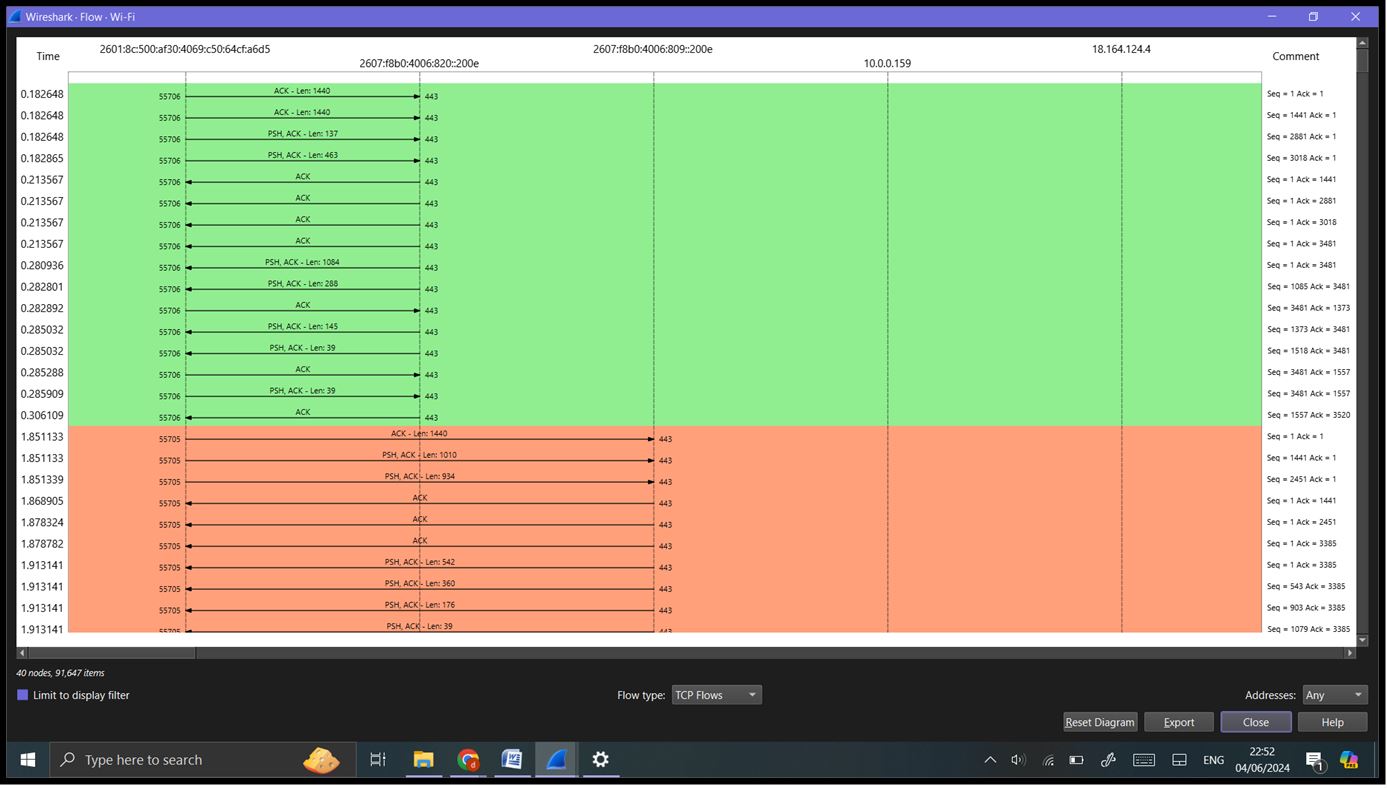
Flow Graphs: Go to ‘Statistics’ -> ‘Flow Graph’. This visualizes the sequence of packet exchanges between hosts, useful for understanding the flow of a session.
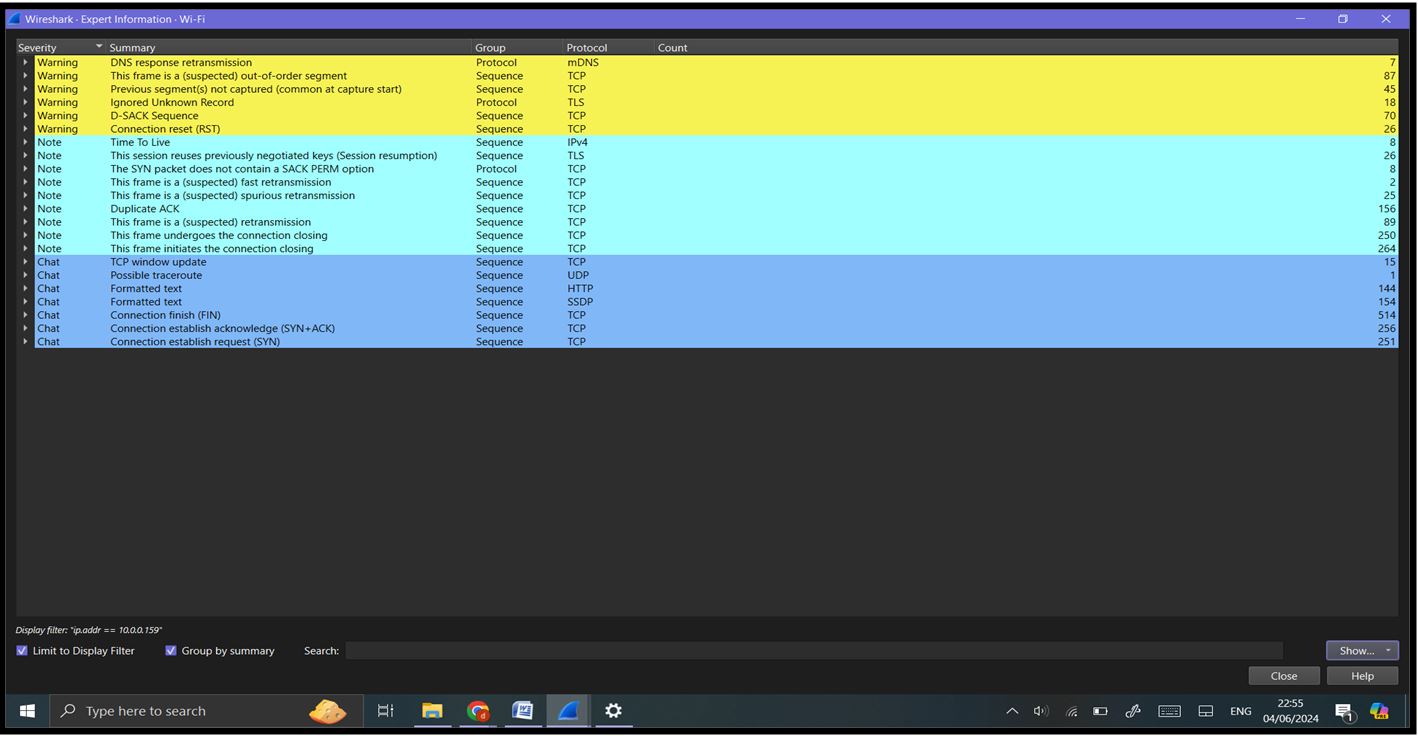
Expert Information: Go to ‘Analyze’ -> ‘Expert Information’. This displays potential issues detected by Wireshark, such as retransmissions, packet loss, or malformed packets.
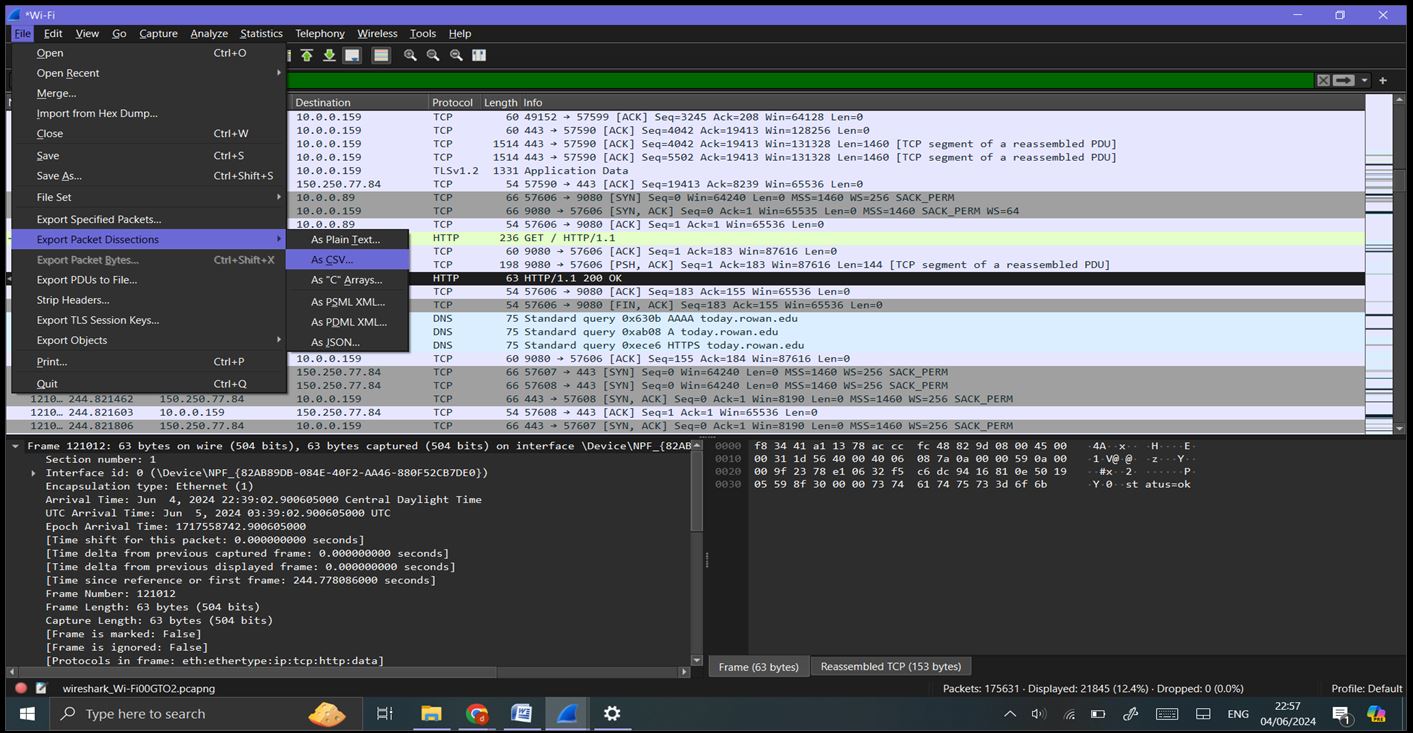
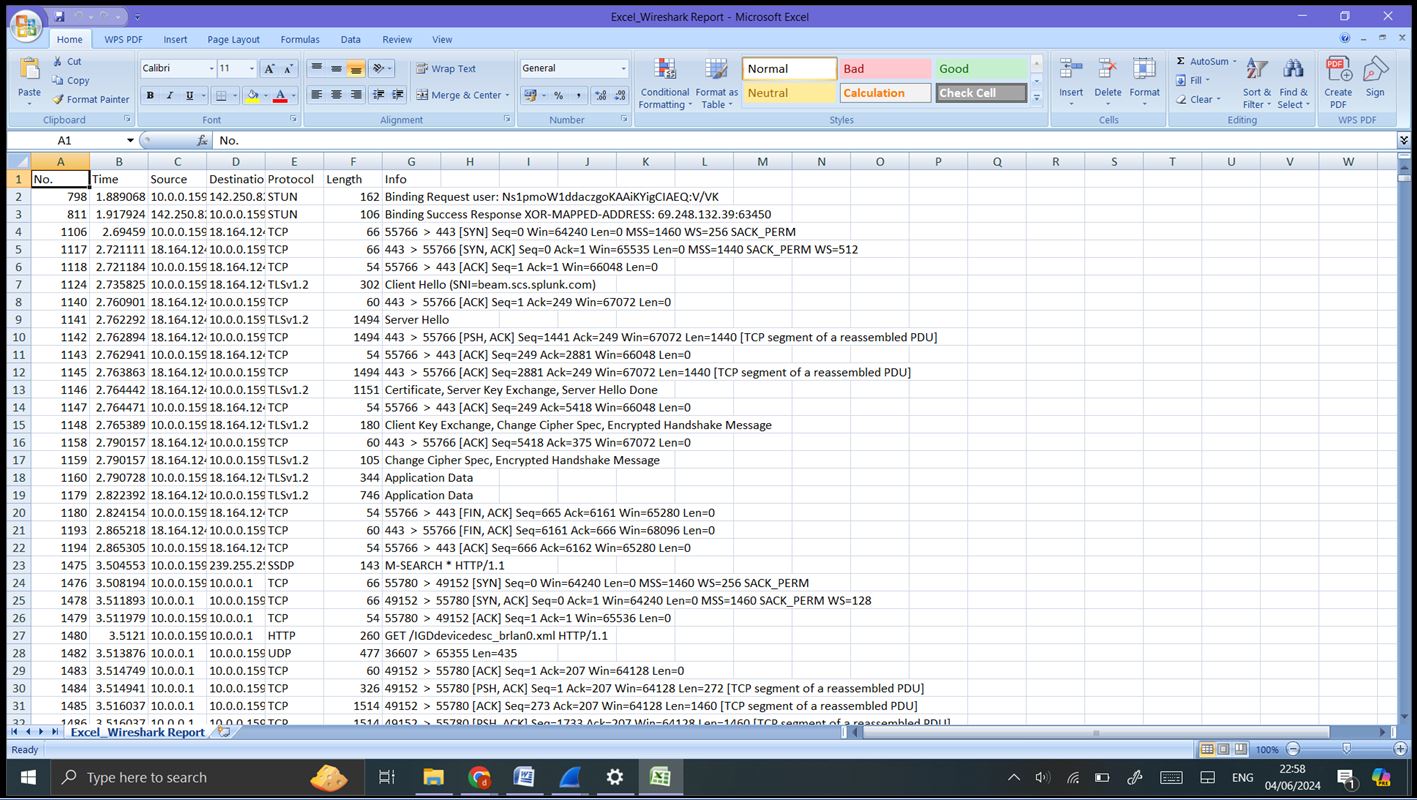
Step 7: Reporting and Documentation: Generating Reports: Export specific capture data or statistics by going to ‘File’ -> ‘Export Packet Dissections’ -> ‘As CSV’/’As XML’/’As Plain Text’. Save the capture file for sharing or further analysis by going to ‘File’ -> ‘Save As’ and choosing the appropriate format.