SIEM-Security-Information-and-Event-Management
Security Monitoring and Logging using SIEM
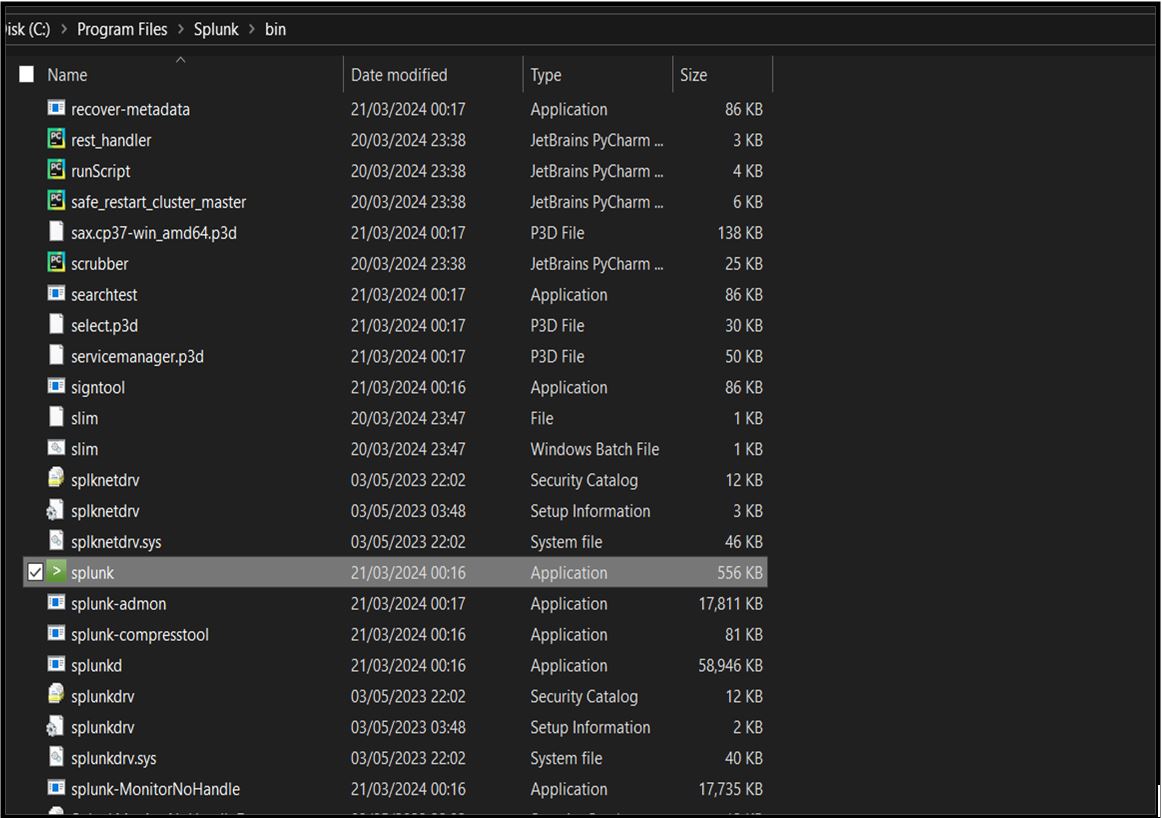
Step 1: If you didn’t choose to start Splunk during the installation, start it manually by navigating to ‘C:\Program Files\Splunk\bin’ and running ‘splunk.exe start’.
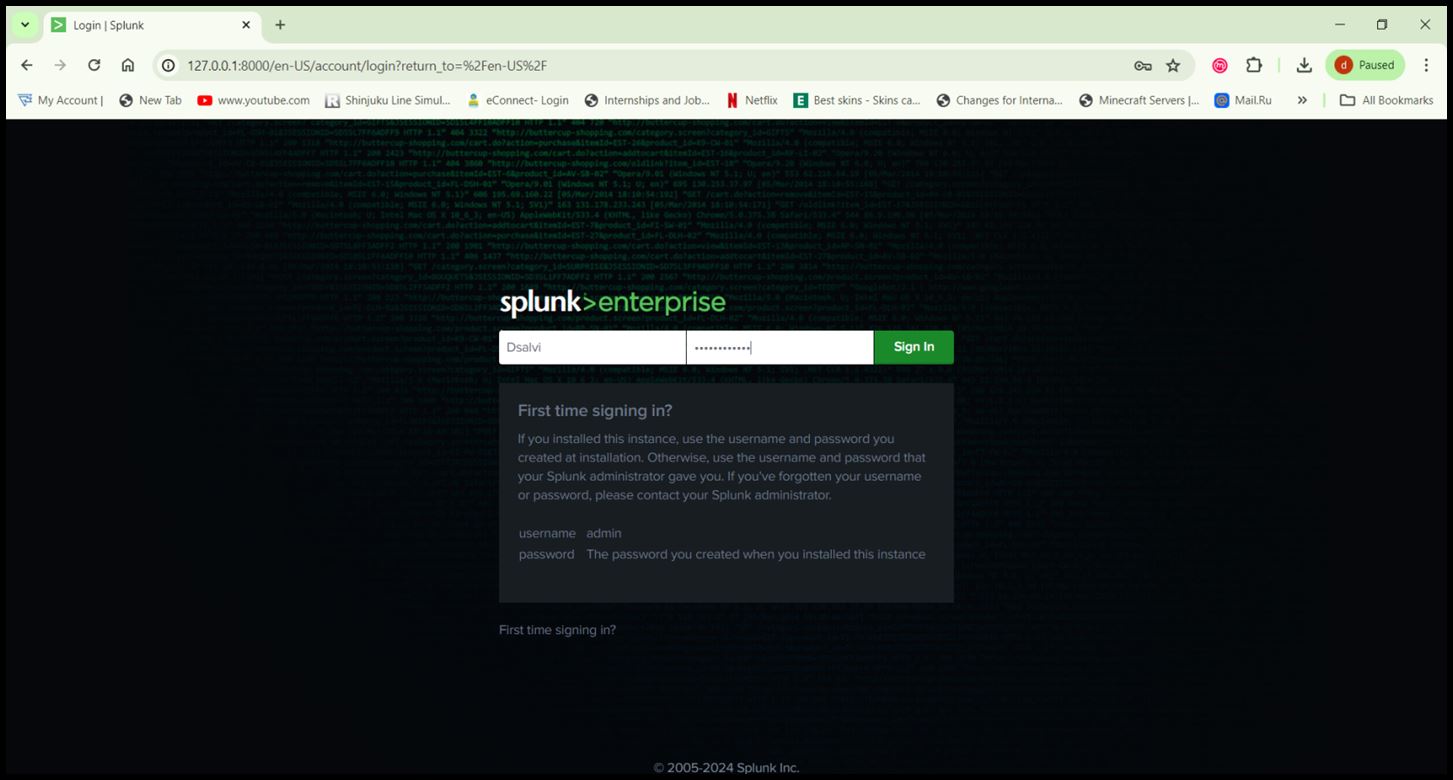
Step 2: Open Splunk Web:
- Open a web browser and go to ‘http://localhost:8000’.
- Log in with the username and password you created during installation.
Step 3: Configure Splunk:
- Follow the initial setup prompts to configure basic settings like time zone and email settings.
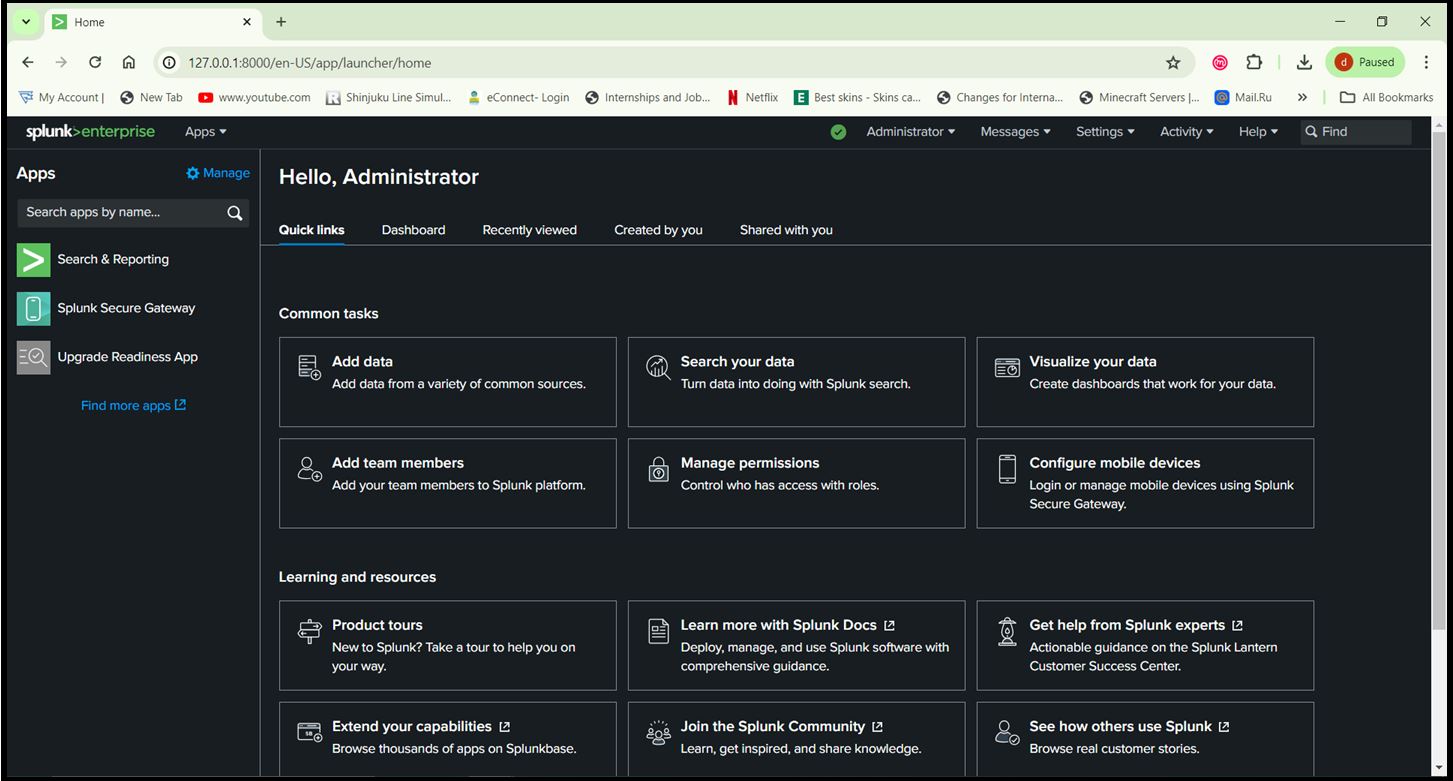
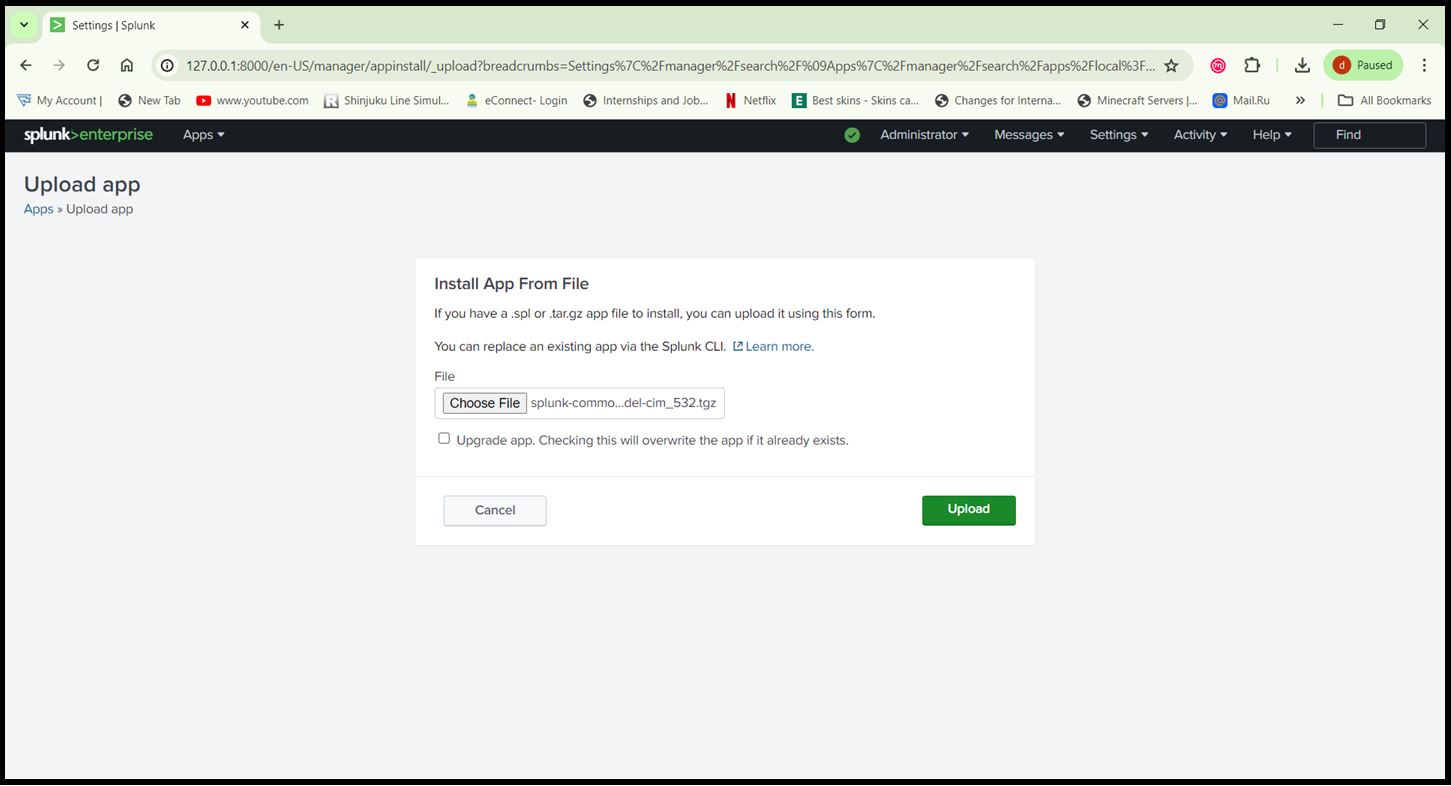
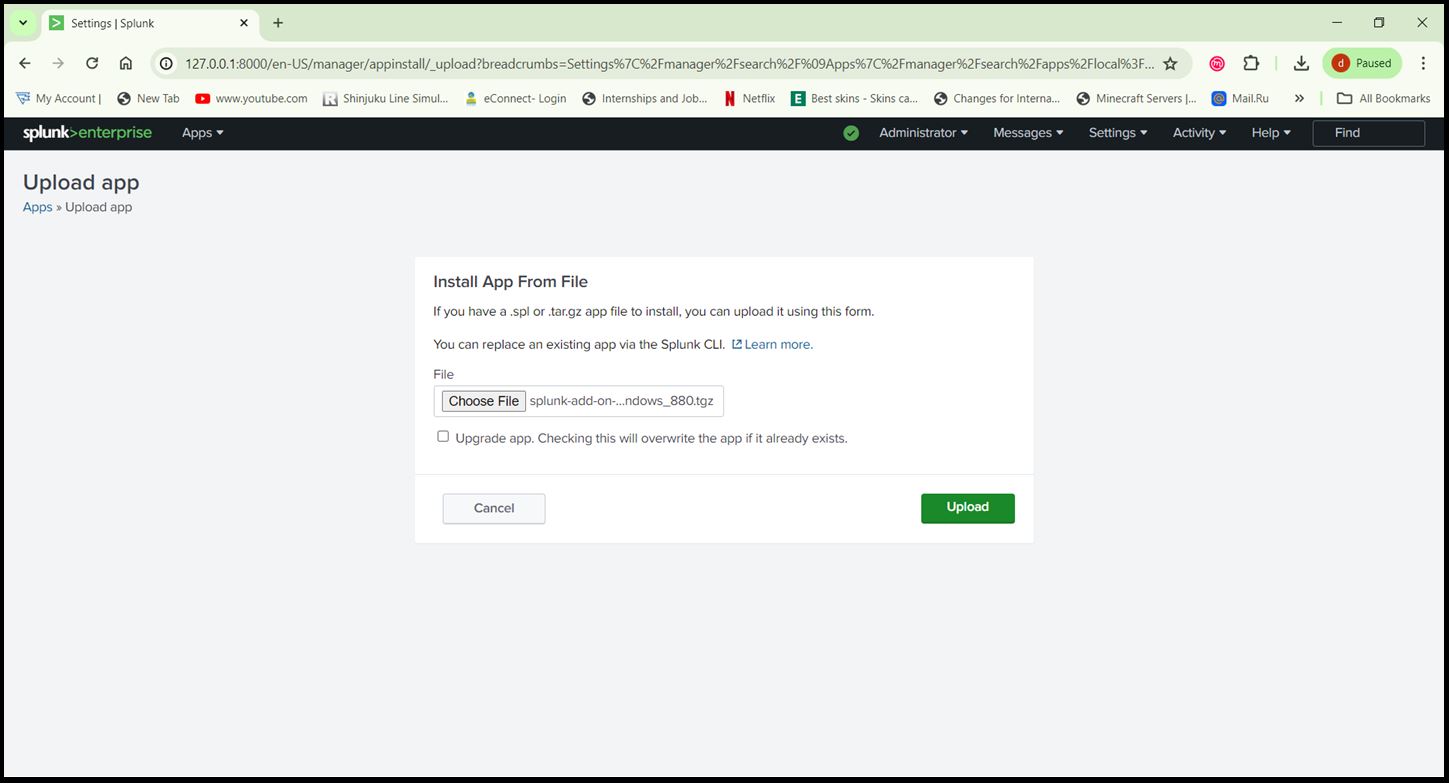
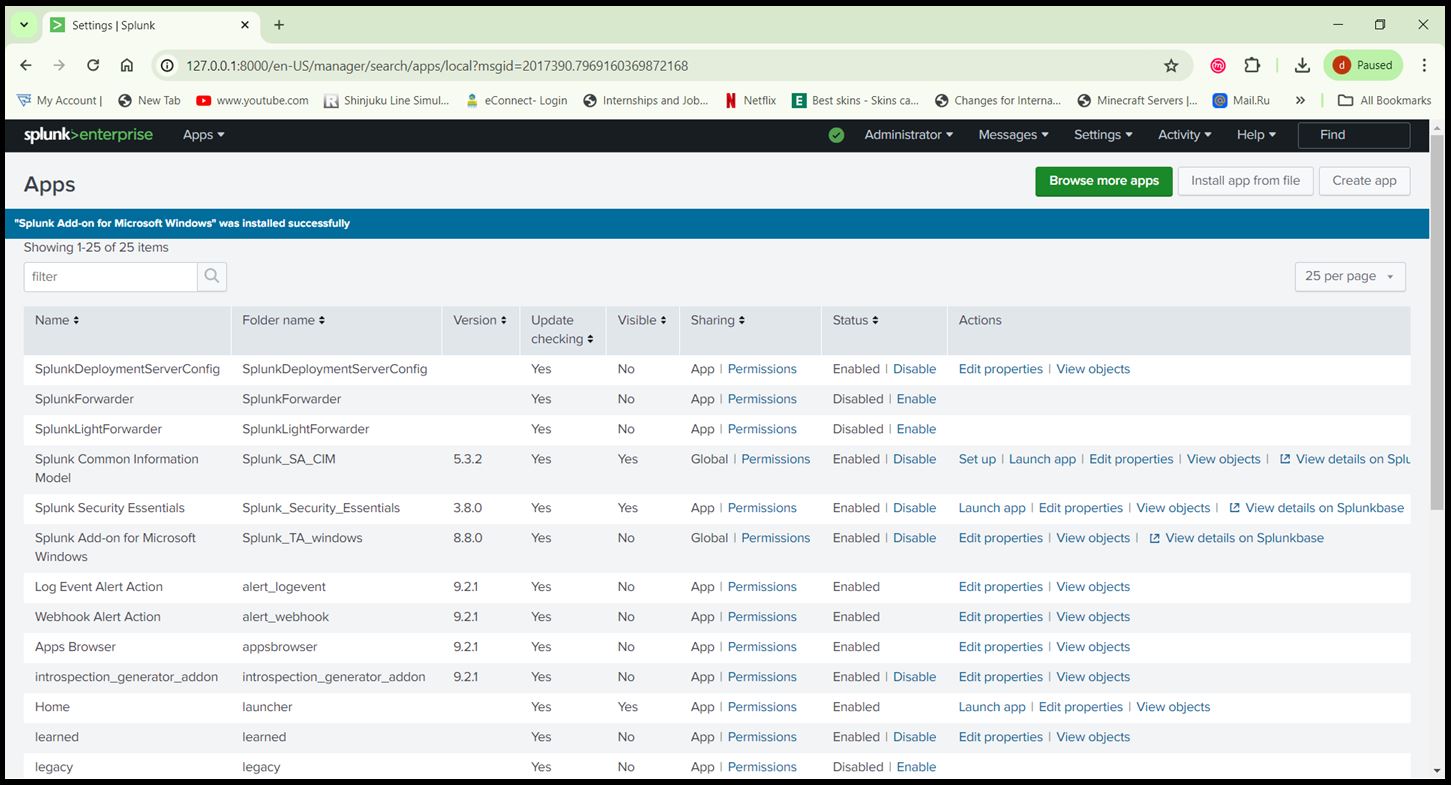
Step 4: Install Necessary Splunk Apps for SIEM
- In Splunk Web, go to ‘Apps > Manage Apps’.
- Click ‘Install app from file’ and upload the downloaded ‘.spl’ files.

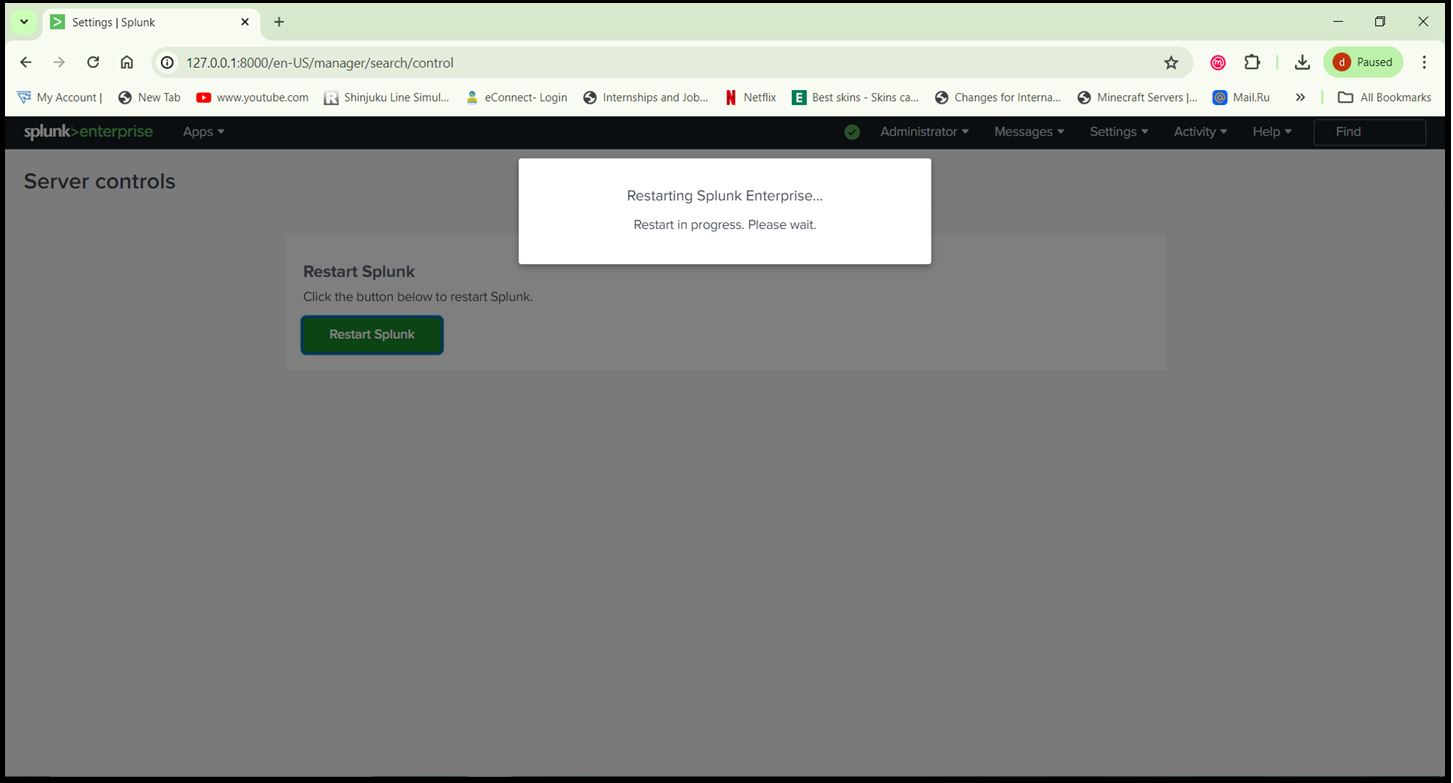
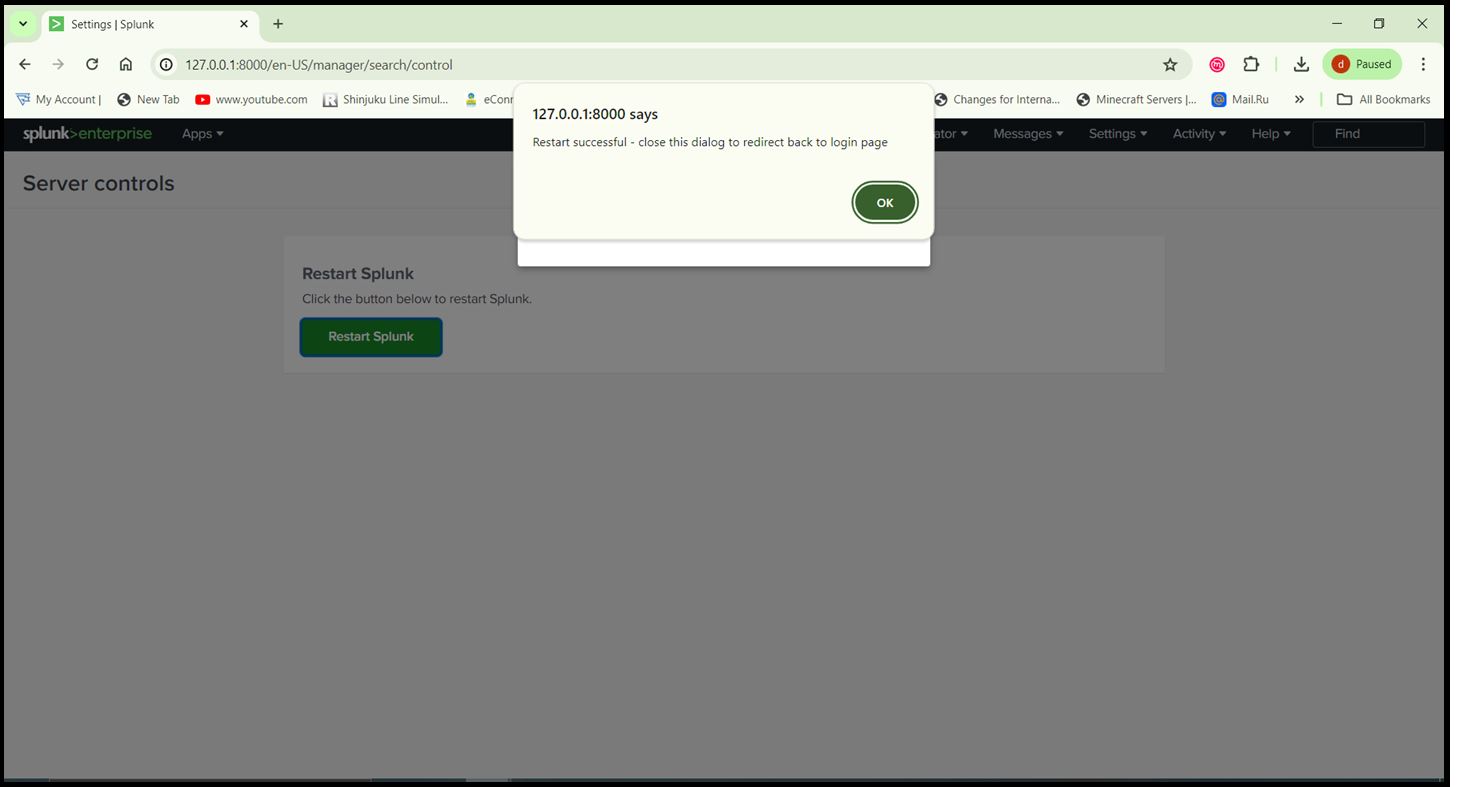
Step 5: After installing the apps, restart Splunk to apply the changes. Go to ‘Settings > Server controls > Restart Splunk’.
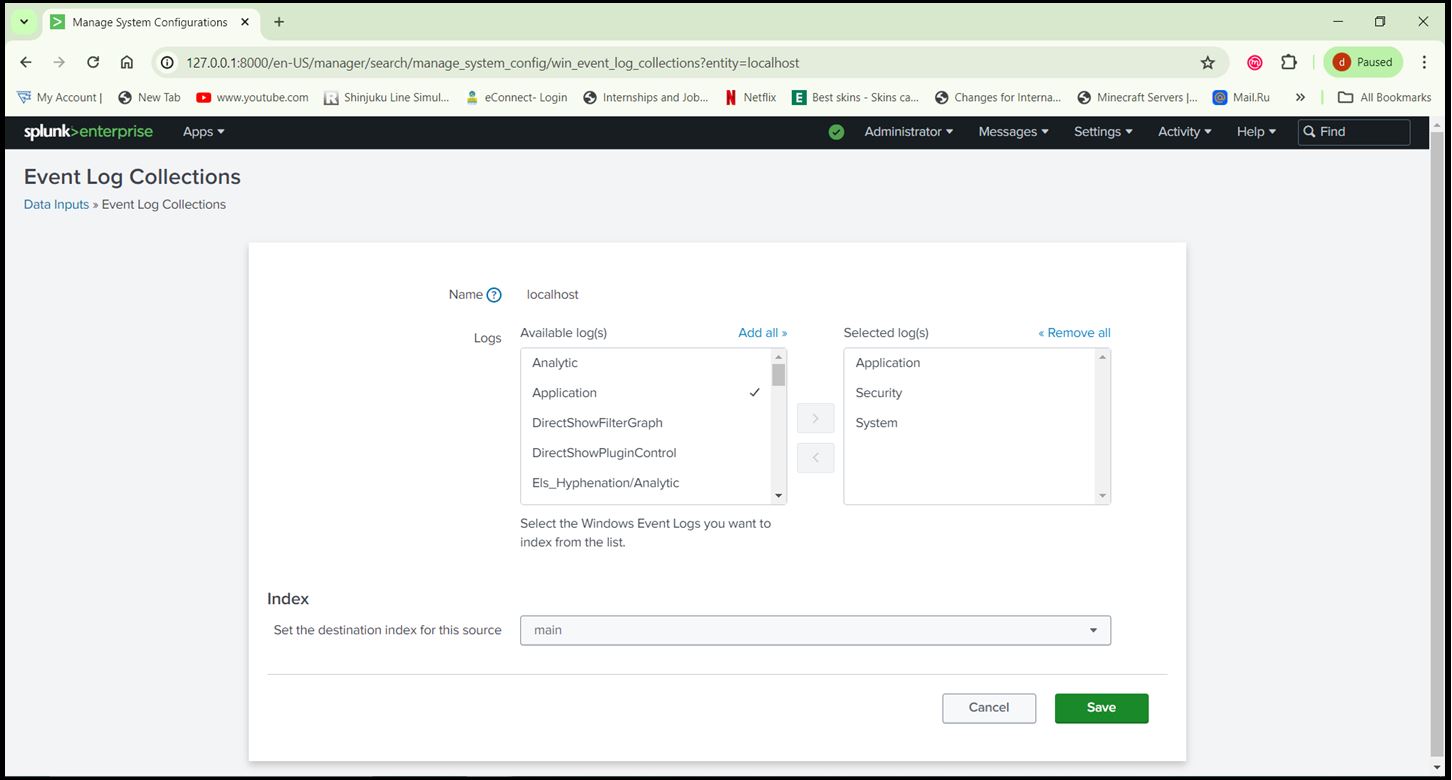
Step 6: Configure Windows Event Logs:
- In Splunk Web, go to ‘Settings > Data Inputs > Local Event Log Collection’.
- Add the event logs you want to monitor (e.g., Application, System, Security).
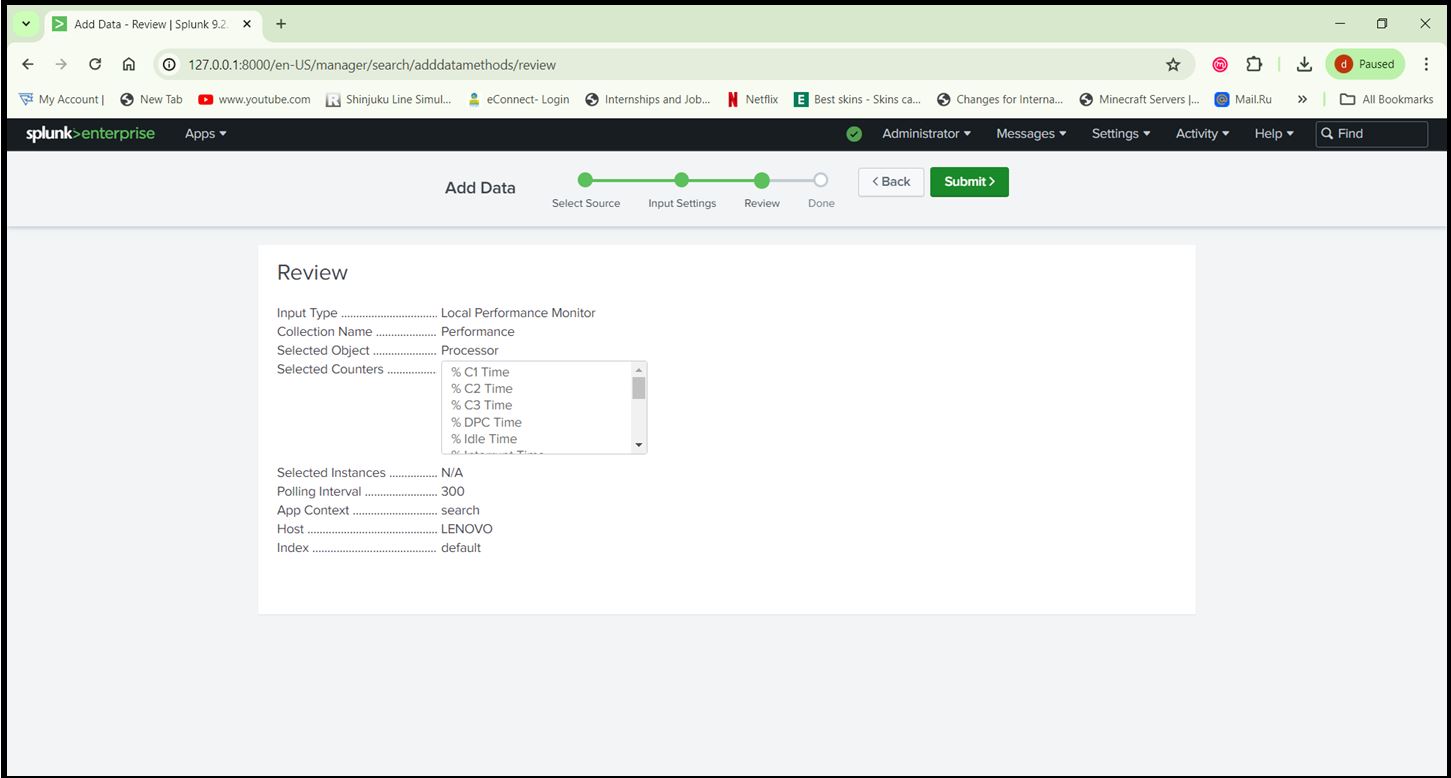
Step 7: Configure Windows Performance Monitoring:
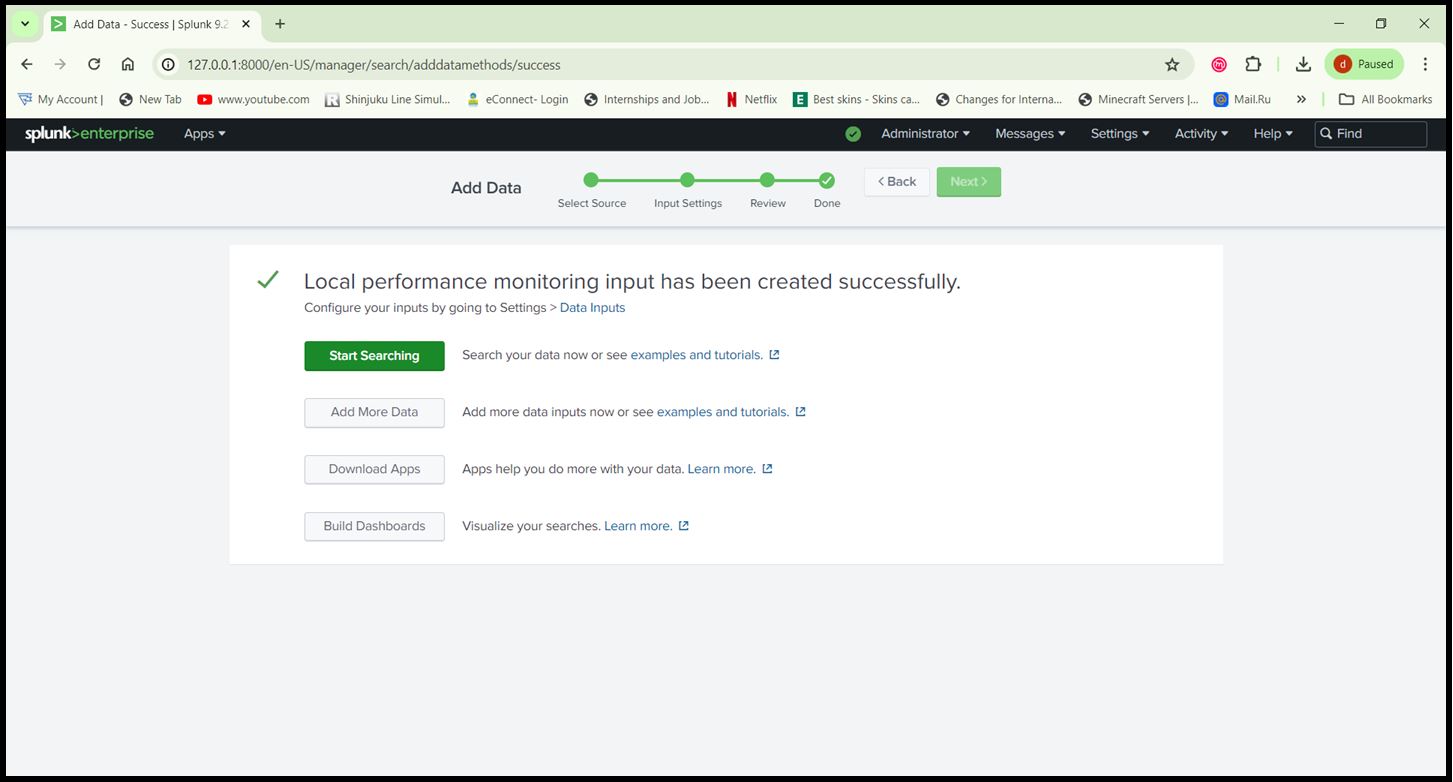
- Go to ‘Settings > Data Inputs> Local Performance Monitoring’.
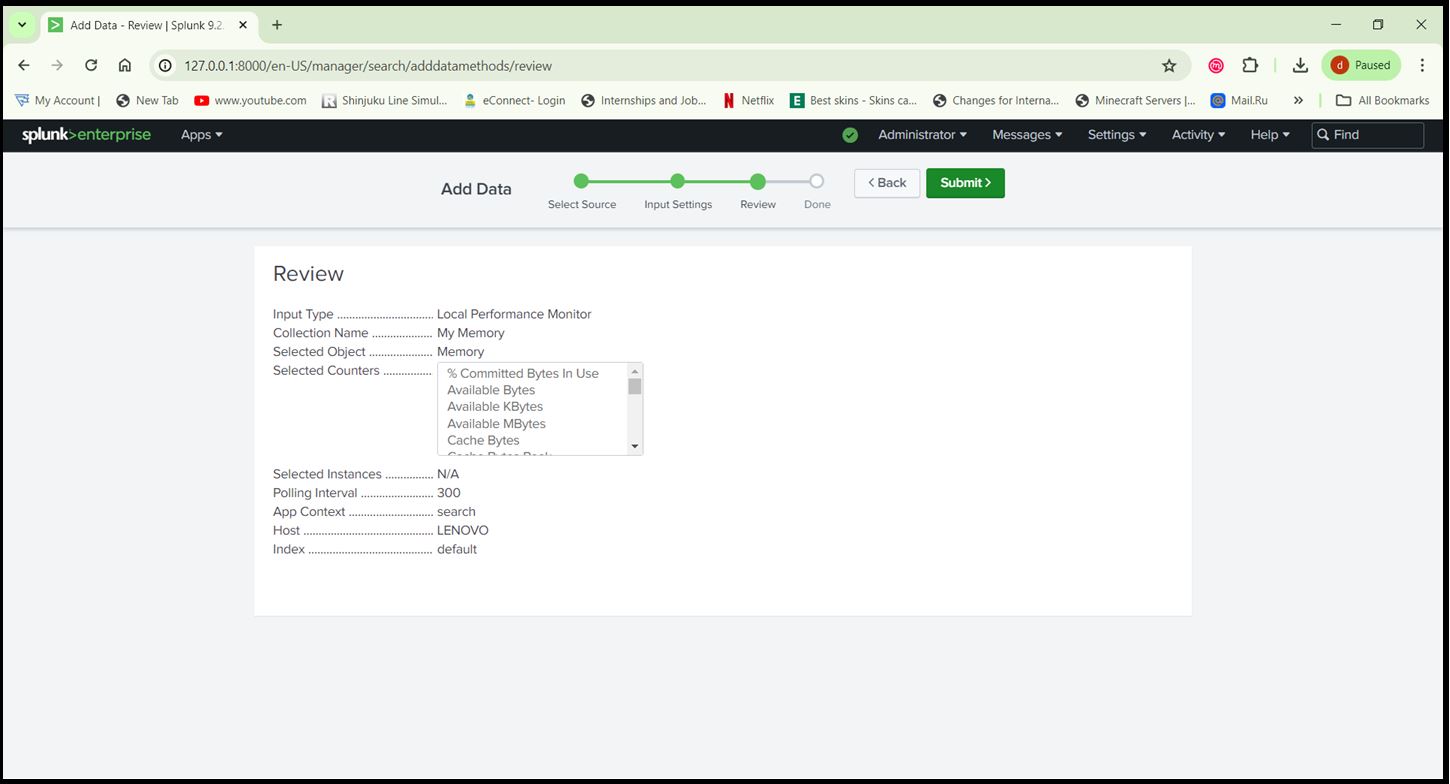
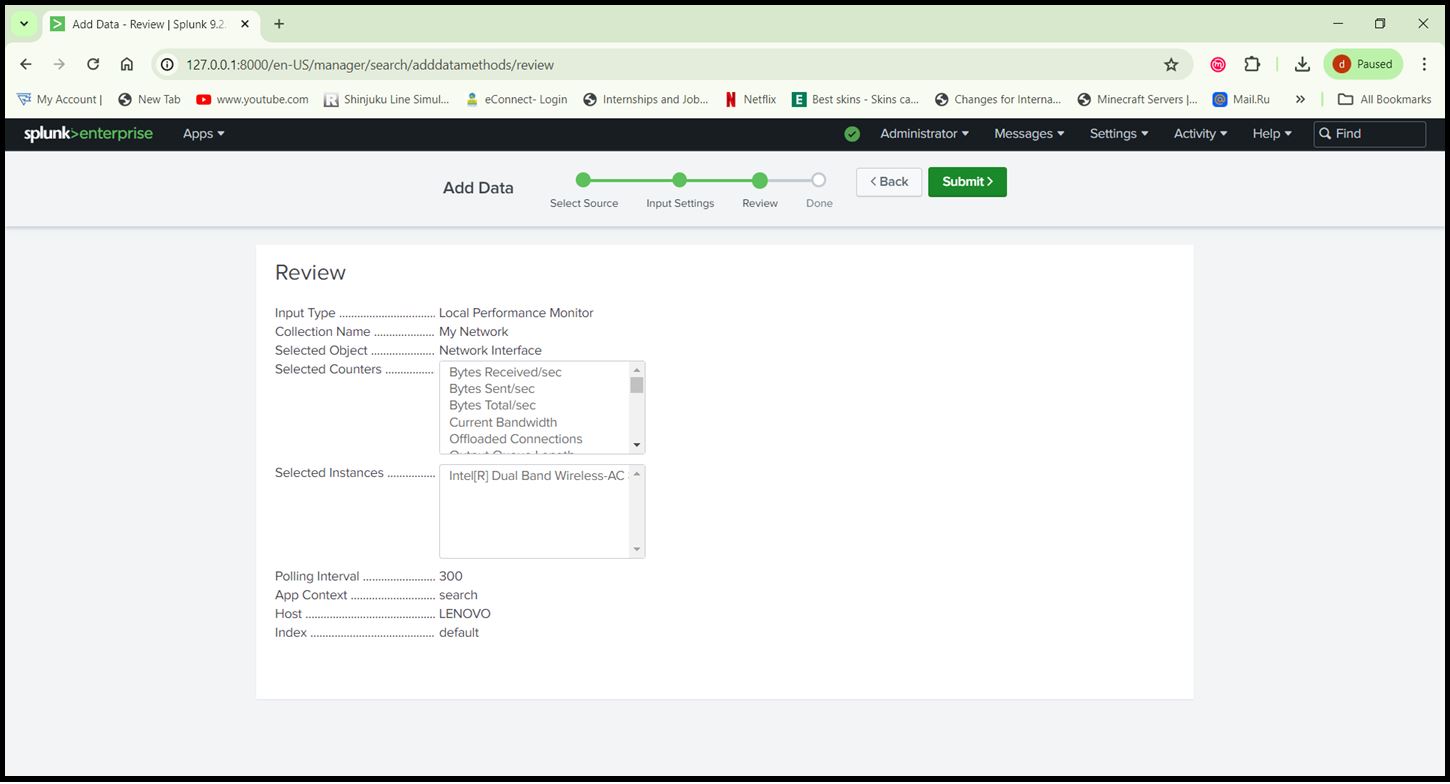
- Add the performance counters you want to monitor (e.g., Processor, Memory, Network).
Processor
Memory
Network
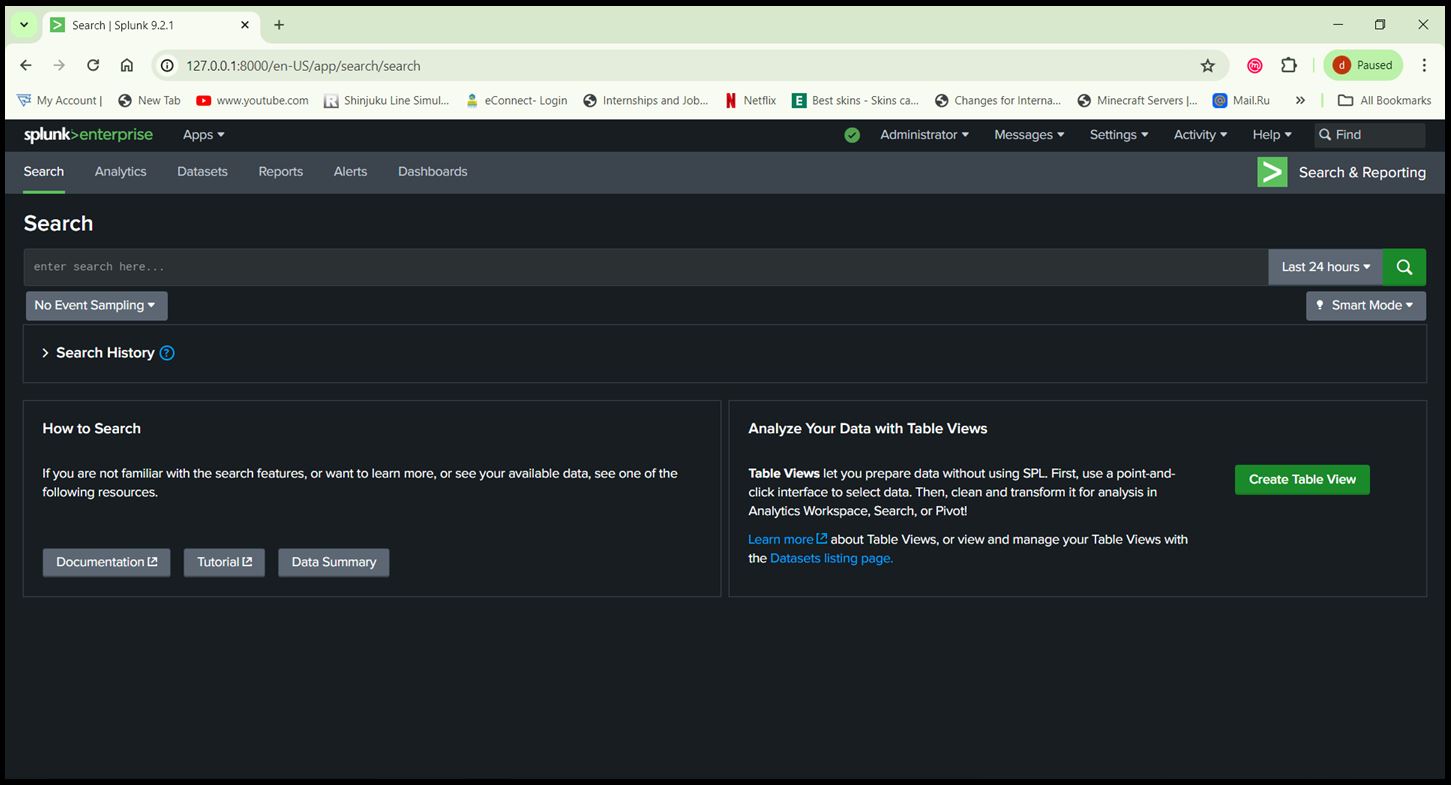
Step 8: Verify Data Ingestion Search for Data:
- In Splunk Web, go to ‘Search & Reporting’.
- Use the search bar to verify data is being indexed: index=main sourcetype=WinEventLog
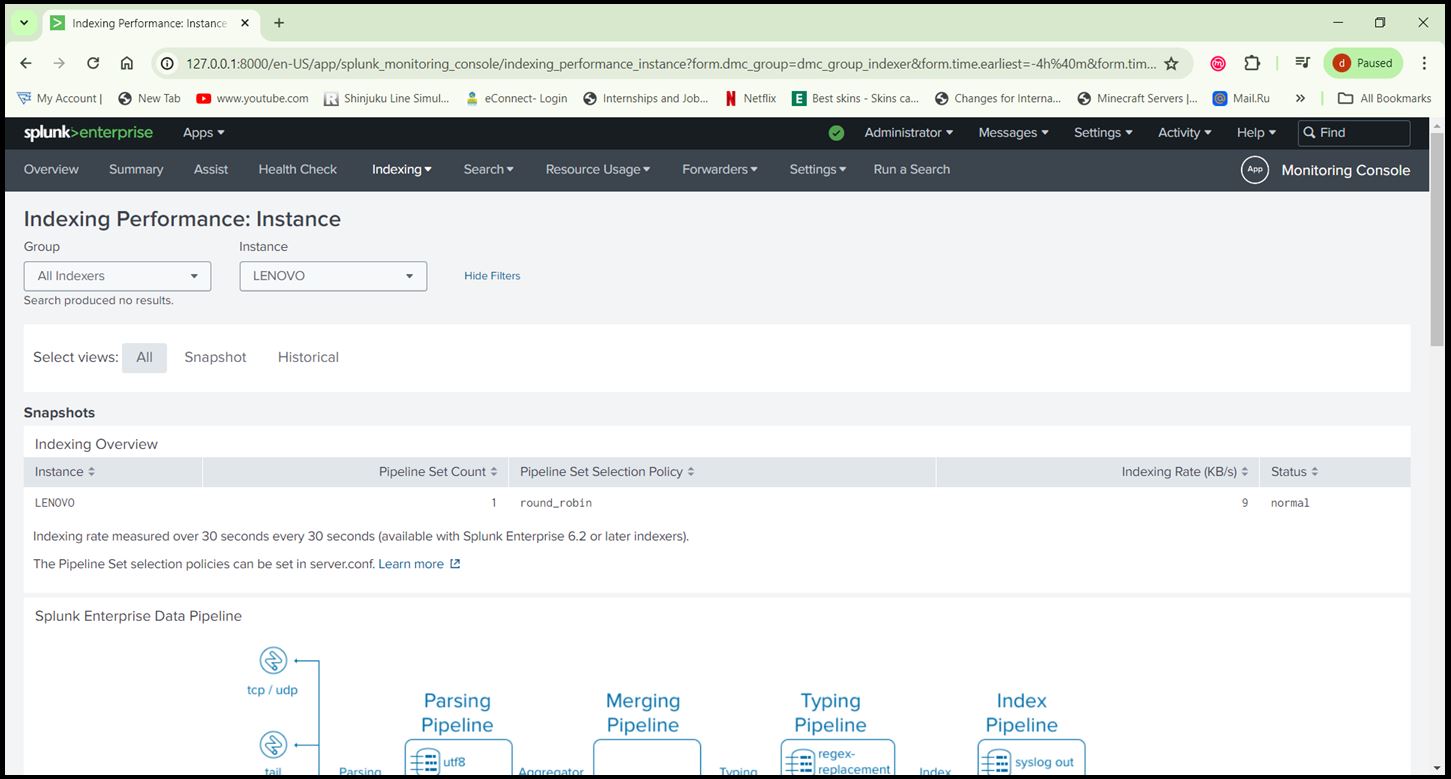
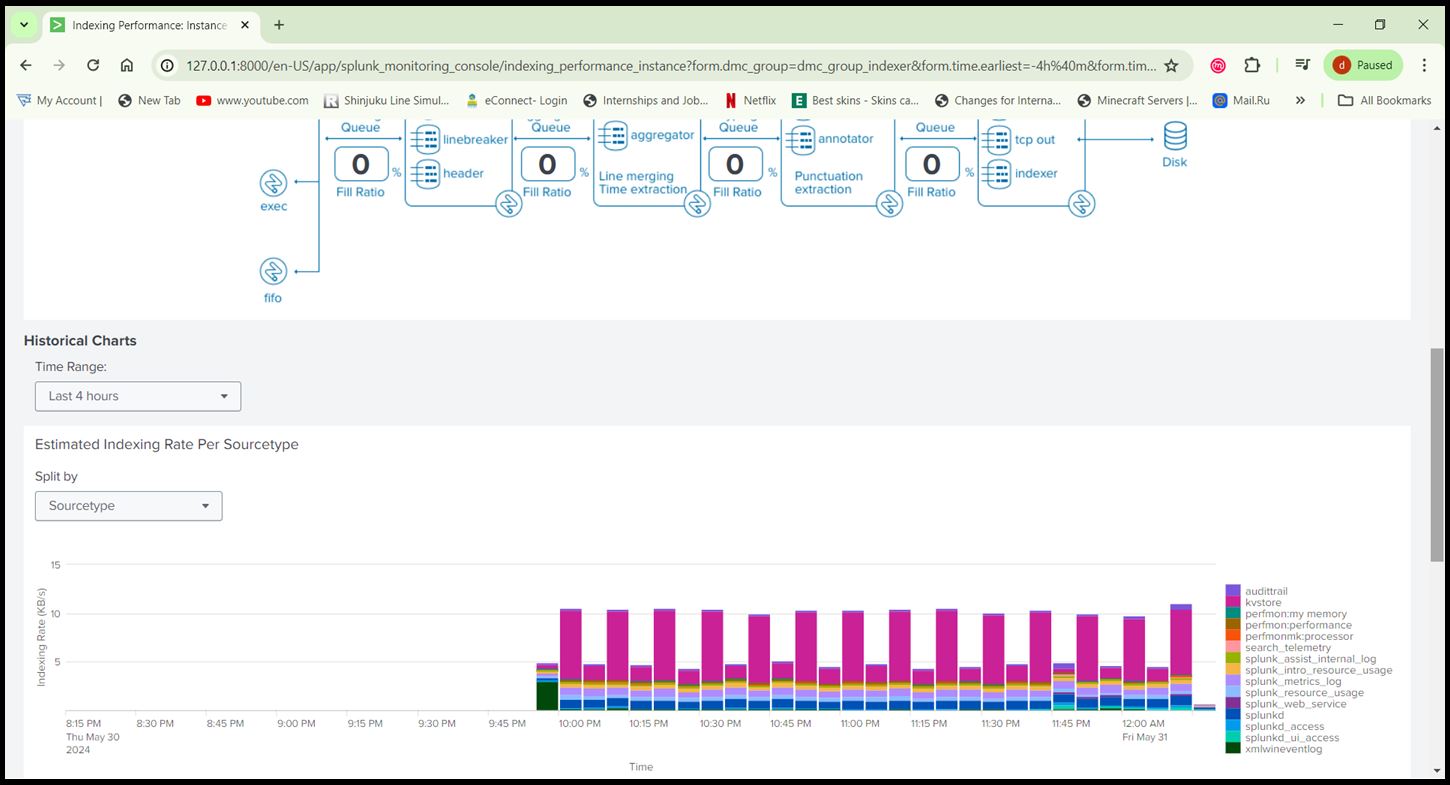
Step 9: Check for Errors:
- Ensure there are no errors in data collection by checking ‘Settings > Monitoring Console >Indexing > Indexing Performance’.
Step 10: Create Alerts & Generate Report:
- Go to Settings > Searches, Reports, and Alerts.
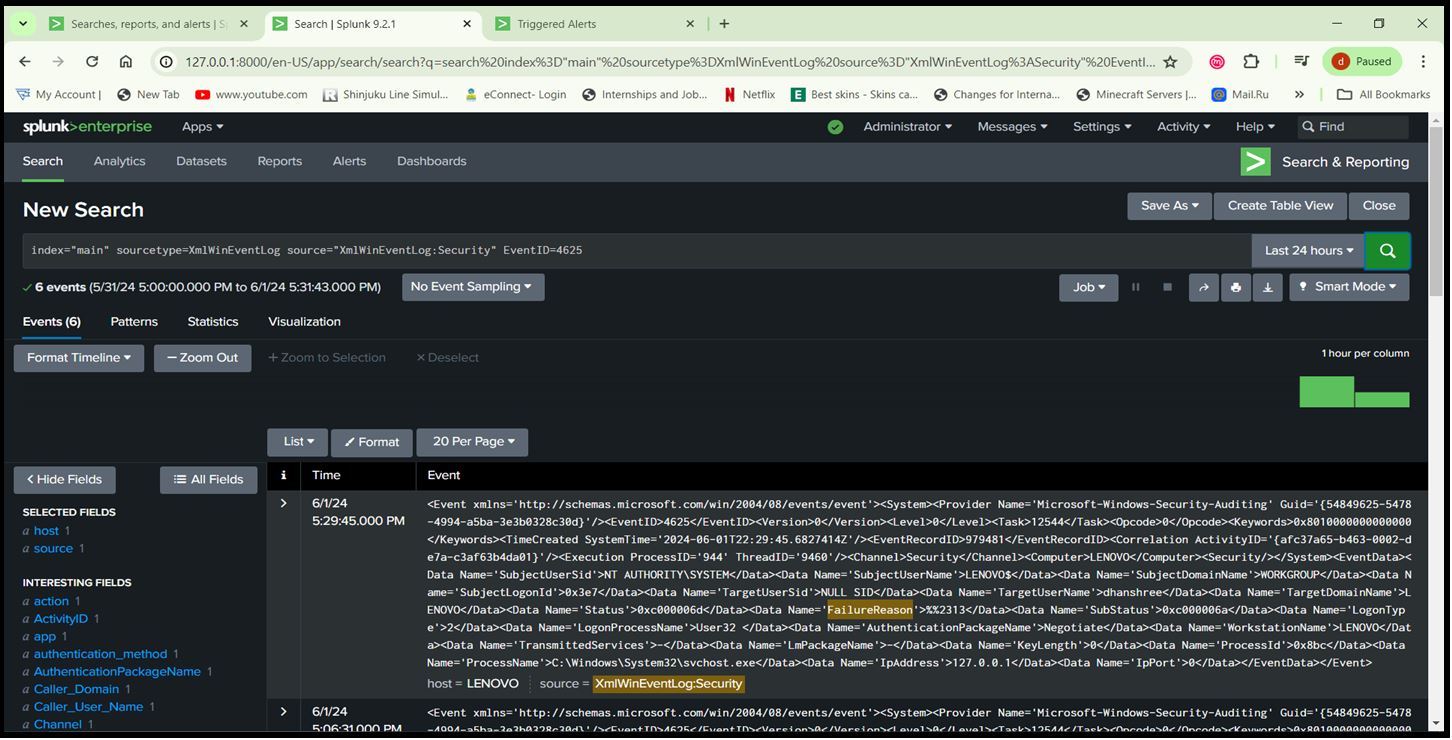
- Create new alerts based on the security events you want to monitor (e.g., failed logins).
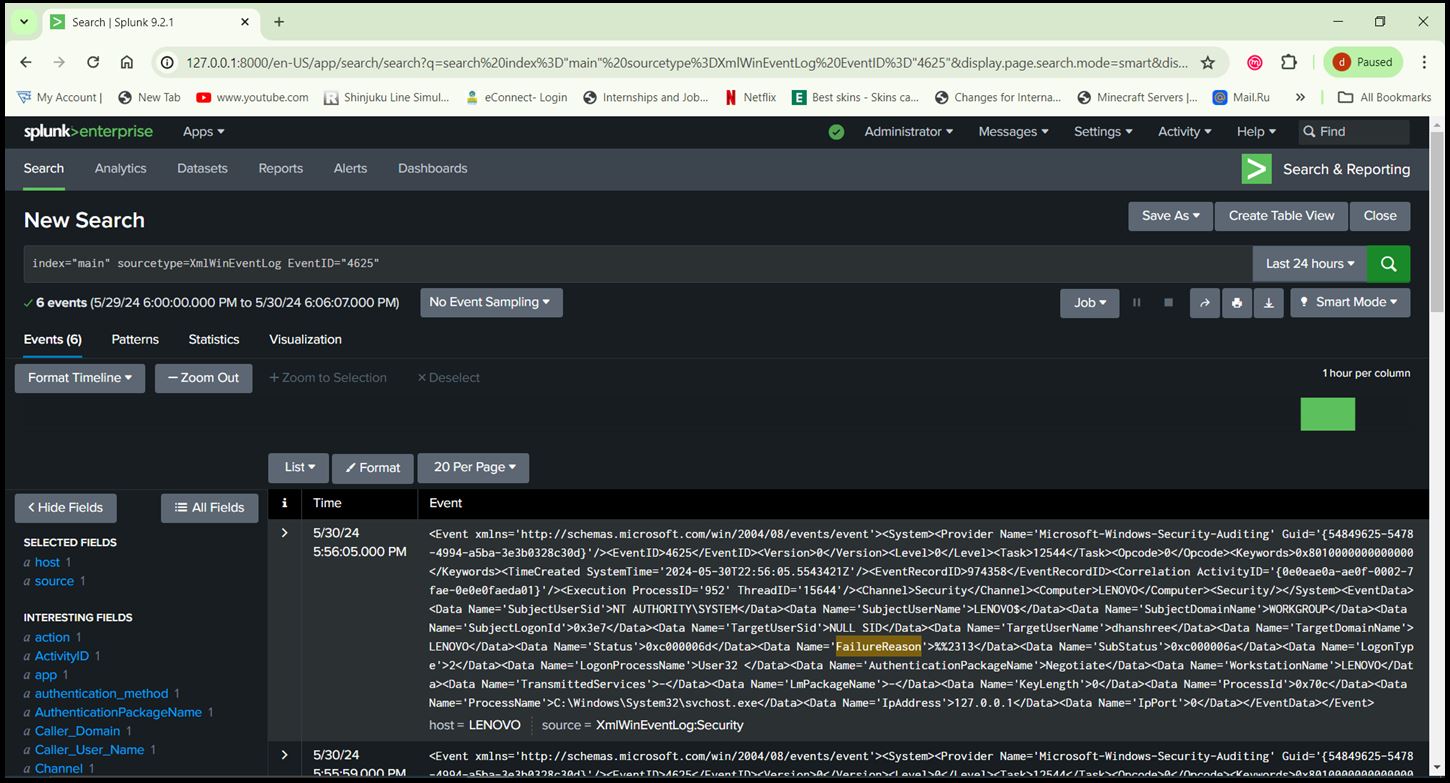
- Go to Apps > Search & Reporting > Run the below Query > Click on ‘Save As’ > Report. Query: index=”main” sourcetype=XmlWinEventLog source=”XmlWinEventLog:Security” EventID=4625
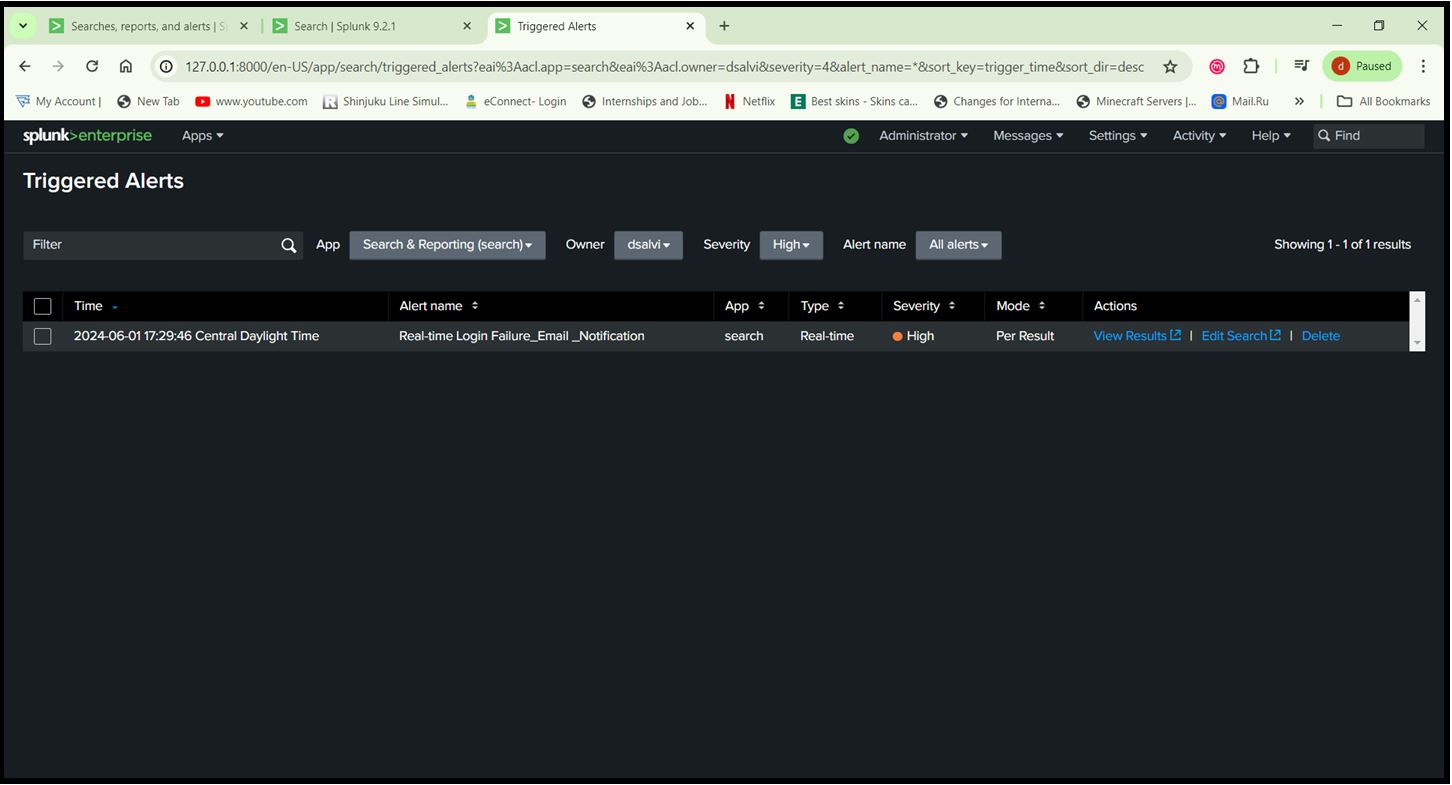
Go to Activity > Triggered Alerts
Generated Report for Event ID 4625
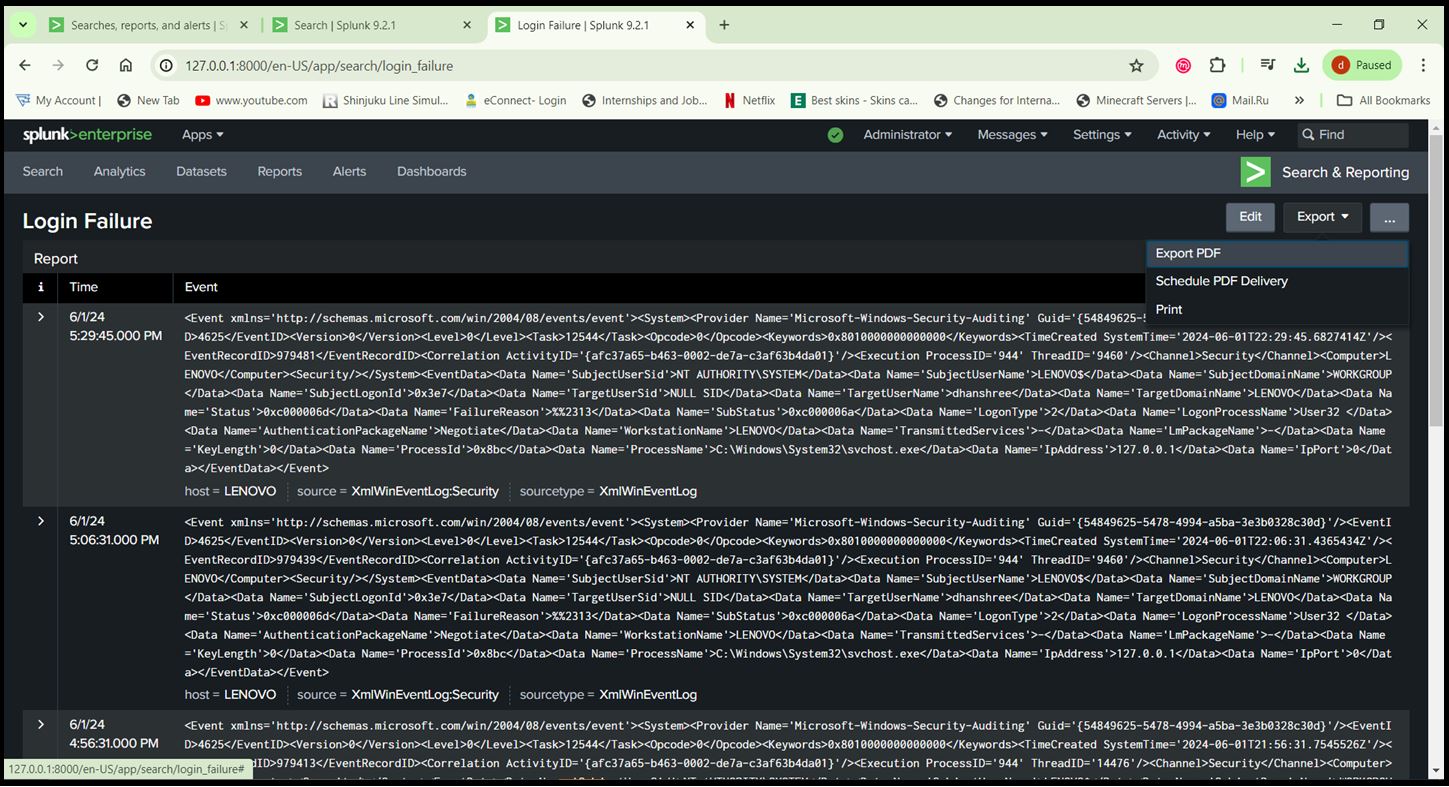
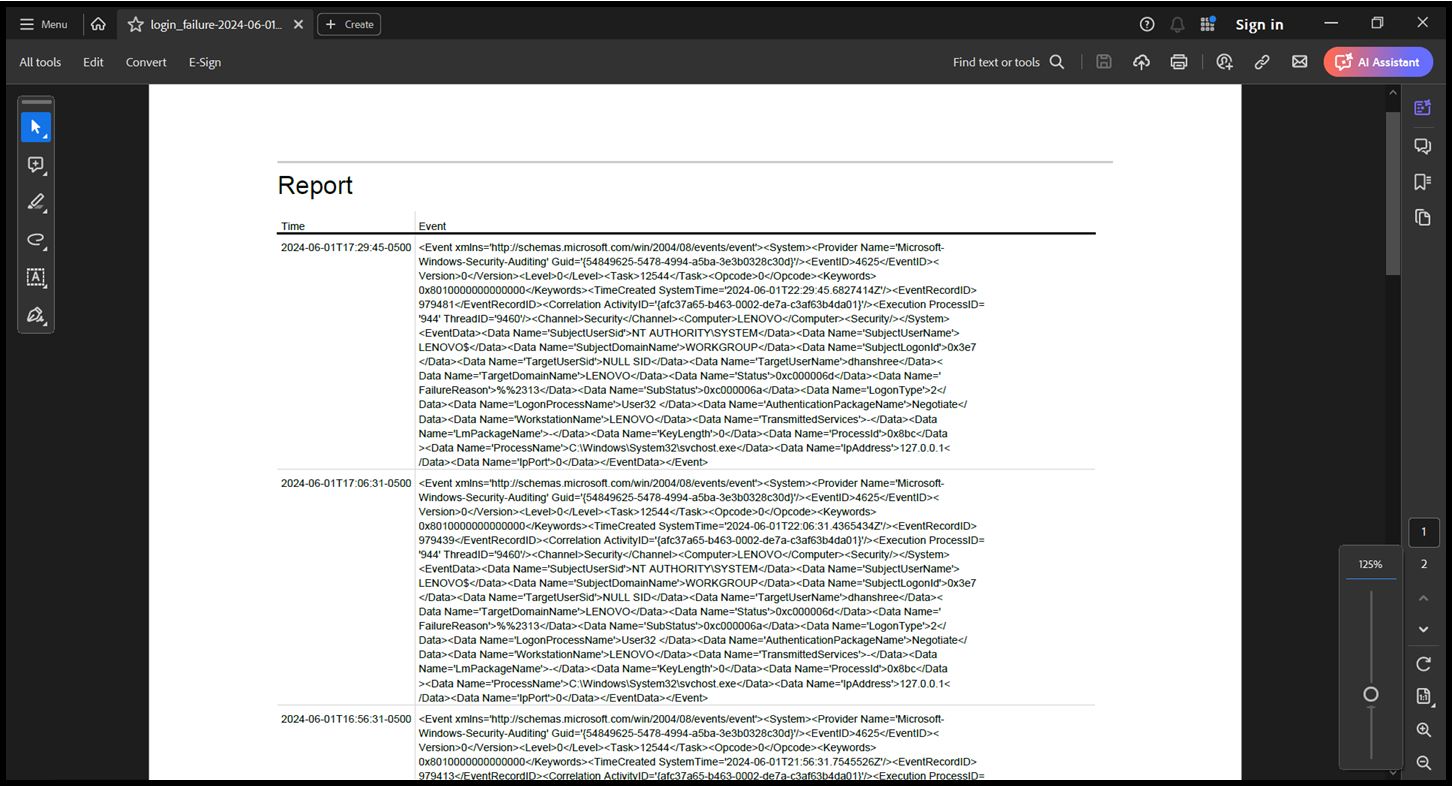
Exported Report as PDF
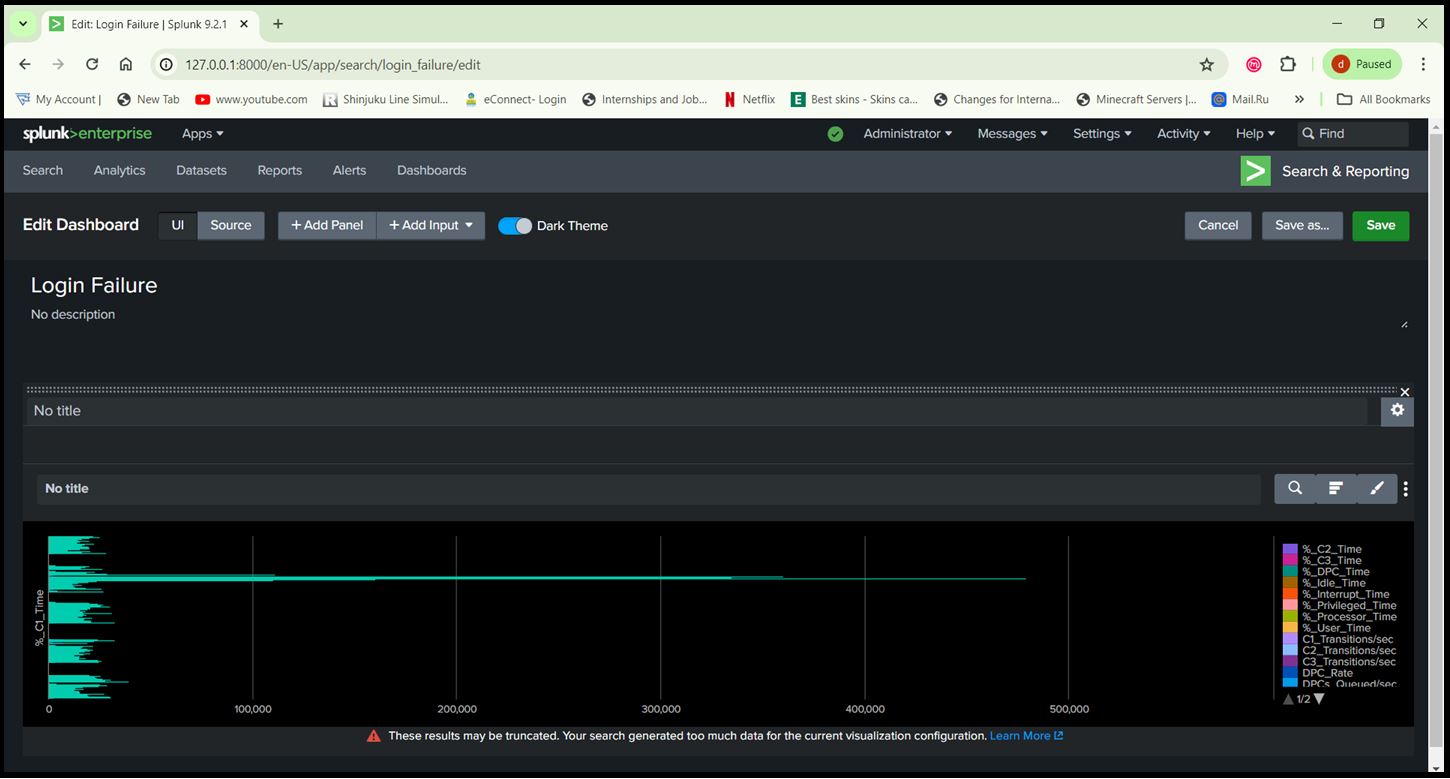
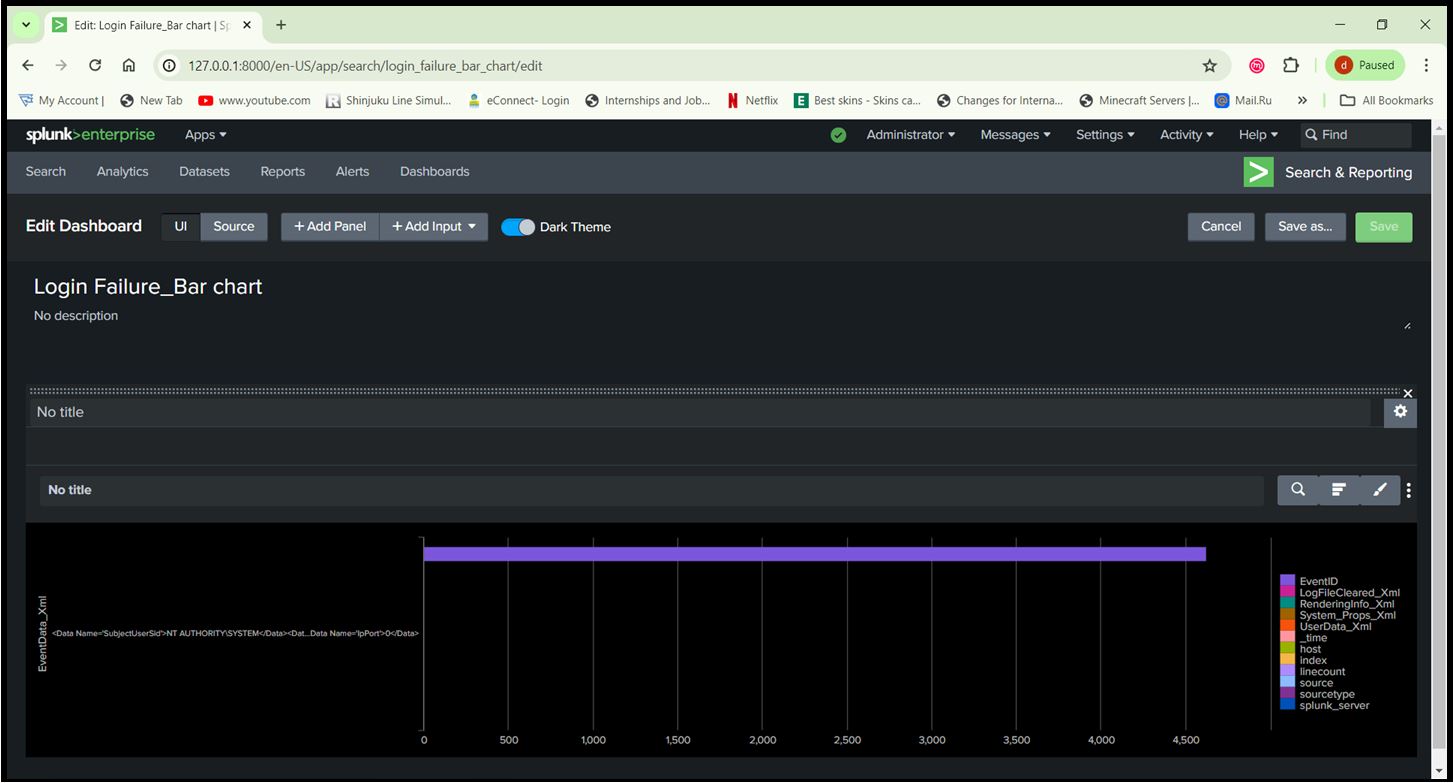
Step 11: Create Dashboards:
- Use the ‘Dashboard’ feature to create visual representations of your data.
- Add panels to display metrics such as login attempts, suspicious activities, system performance, etc. String: index=”main” sourcetype=XmlWinEventLog source=”XmlWinEventLog:Security” EventID=4625
Query: index=”main”